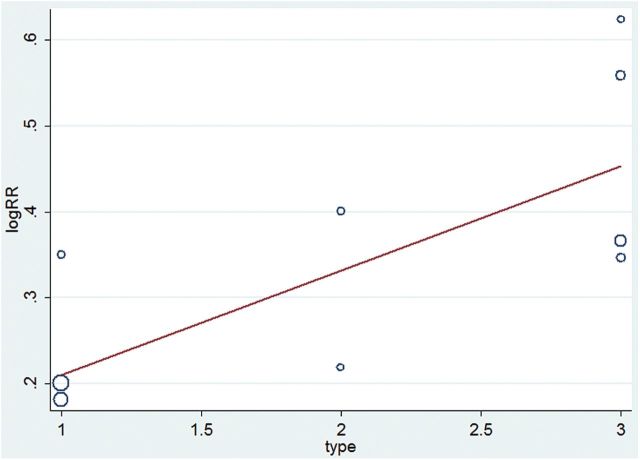
Figure 4.
Meta-regression analysis of response rate in treatment-resistant depression. Type 1 indicates the TRD 1 group, 2 indicates the TRD 2 group, and 3 indicates the TRD 2–4 group. The coefficient is 0.121257, and the p value is 0.050. RR, risk ratio; SAT, standard antidepressant therapy; TRD, treatment resistant depression; TRD 1, defined by no history of treatment failure to SAT within the current depressive episode; TRD 2, defined by history of two treatment failures to SAT within the current depressive episode; TRD 2–4, defined by history of two to four treatment failures to SAT within the current depressive episode.

