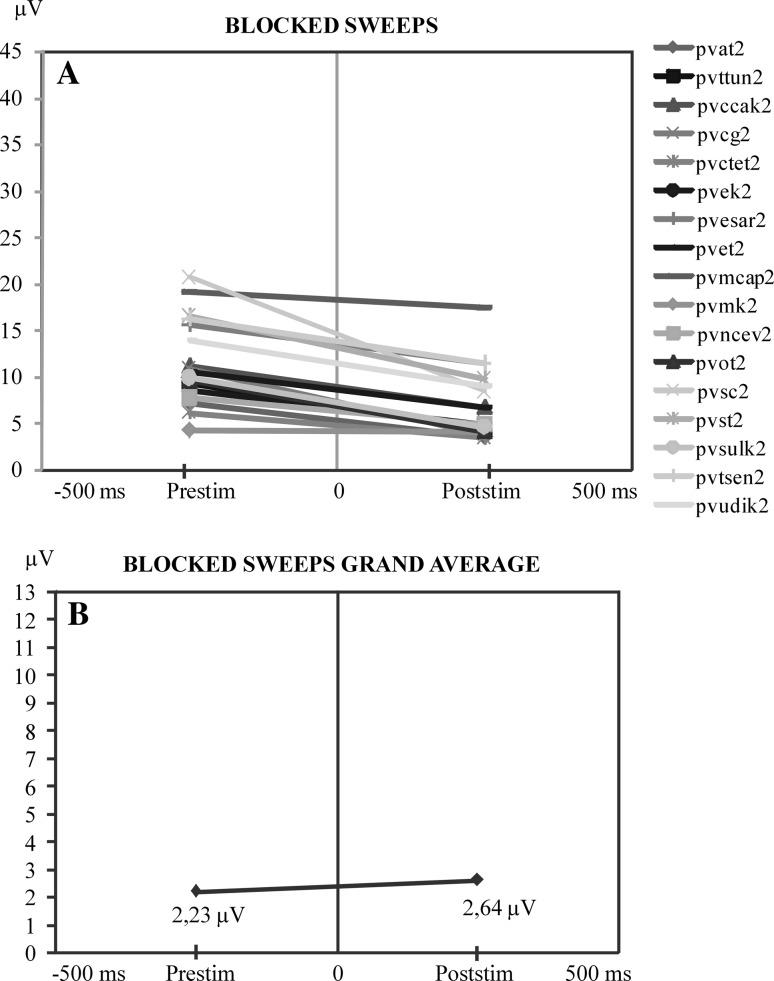
Fig. 3.
a Comparison of the maximum values of pre-stimulus and post-stimulus alpha responses along the time axis. At the ordinate is the maximum peak-to-peak amplitude of the pre-stimulus activity prior to stimulation. At the right side of the illustration is the maximum of alpha amplitude in the time interval of 0–200 ms following stimulation. This illustration shows that when pre-stimulus activity is high the post-stimulus alpha oscillations are highly reduced. b Display of the mean value curve of all subjects in a

