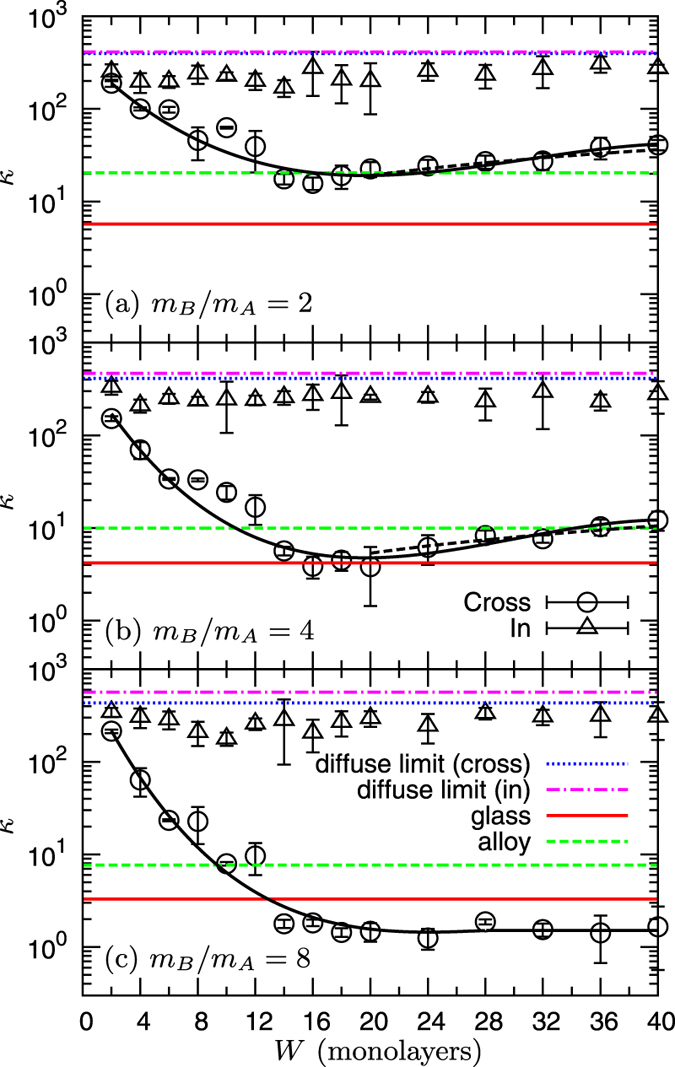
Figure 2. Thermal conductivity in superlattice S1 composed of two intercalated crystalline layers with different masses.

The cross-plane, κCP, and in-plane, κIP, components of thermal conductivity are plotted as functions of the repetition period W. The ratio mB/mA of the masses in layers A and B is 2 in panel (a), 4 in (b), and 8 in (c). The values  and
and  of the diffuse limits (W → ∞), as well as those in the glass and the disordered alloy with the same constituent species are indicated by the horizontal lines. In panels (a) and (b) we also show (dashed black lines), the prediction of Eq. (1) for κCP in the incoherent regime, W > 20, with the values of R and
  included in Table 1. The solid curve interpolating the κCP data points in the entire W-range is a guide for eye. The calculation of the displayed error bars is detailed in the Methods section.
