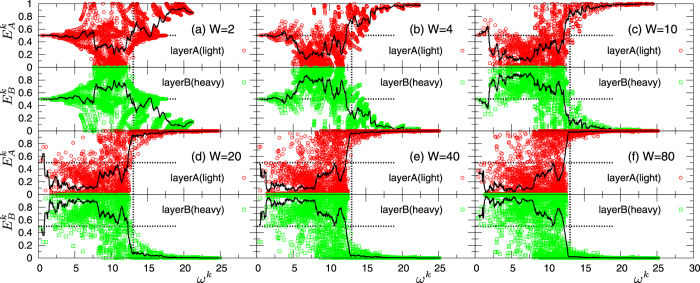
Figure 4. Vibrational amplitudes of normal modes in superlattice S1, for a mass ratio mB/mA = 4 with mA = 0.4 and mB = 1.6.
The vibrational amplitudes of the eigenvectors,  and
and  , in layers A (light) and B (heavy) for all normal modes k, are plotted as functions of the corresponding eigenfrequency ωk.
  and
and  are defined in Eq. (6). The repetitions period values are W = 2,4,10,20,40,80 in panels (a–f). The solid line represents the average values
  and
and  calculated in bins of the form ωk ± δωk/2, with δωk = 0.5. The horizontal dotted lines represent the threshold value
  , the vertical lines indicate
  , corresponding to the high frequency edge of gB(ω).

