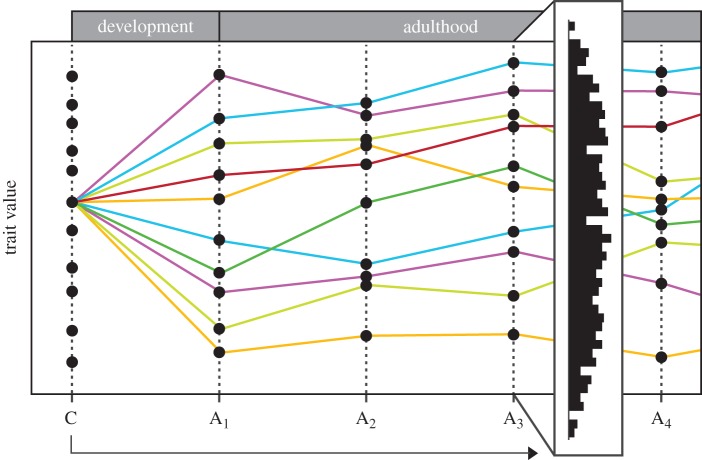
Figure 1.
The contribution of an individual's experience to observed population variation at a single time point. Time is indicated on the x-axis, starting with conception (C); A1 = the cessation of development, followed by successive points in adulthood (A2–A4). The y-axis indicates variation in a single functional trait. At conception (C), the trait varies by virtue of a number of genotypes in the population. Coloured lines represent 10 individuals with the same genotype, and subsequent intra-individual changes in the trait. By adulthood (A1), trait variation has increased through different experiences in development, which is further influenced by experiences in adulthood. Other genotypes (C) result in similar diversification with regard to the trait (not shown). Thus, interpretation of population variation at a given point (frequency distribution at A3) requires consideration of individual histories and all possible sources of individual differences. Note that the pattern of trait diversification in previous and later cohorts will temporally overlap with the cohort shown.

