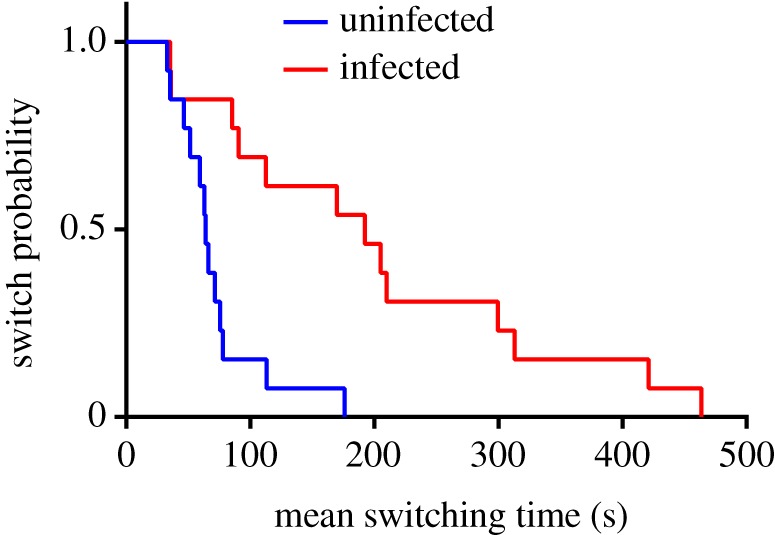
Figure 3.

Kaplan–Meier curves of 14 individuals (eight females and six males) at intervals when negative (blue) and positive (red) for whipworm eggs in faeces. Each curve shows the mean time (seconds) required for an individual to switch behaviour in a 30 min focal period, with the percentage of individuals that have not switched behaviour shown on the y-axis. (Online version in colour.)
