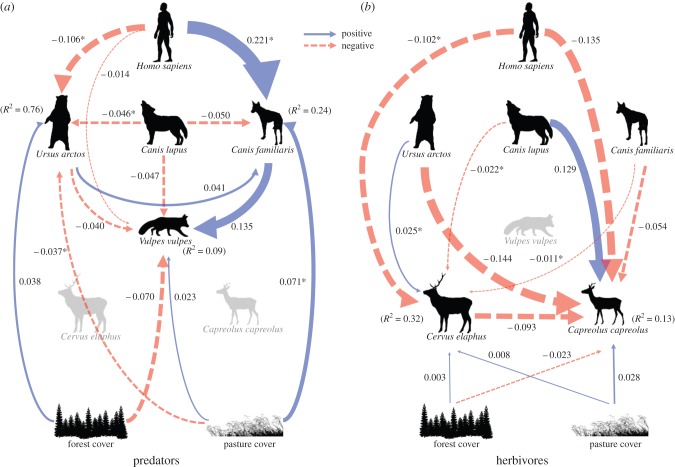
Figure 3.
Final structural equation models showing top-down and bottom-up pathways for encounter rates of (a) predators and (b) herbivores. Positive links are indicated by solid lines and negative links are indicated by dashed lines. Line thicknesses of arrows correspond to their standardized path coefficients as calculated by the ‘relevant range’ method. These indicate the relative strengths of effects and are comparable across the entire model. Marginal R2 is given for all response variables (i.e. brown bear, domestic dog, red fox, red deer and roe deer). Asterisk indicates where 95% CIs around the estimates from the global models do not include zero (electronic supplementary material, table S2). (Online version in colour.)

