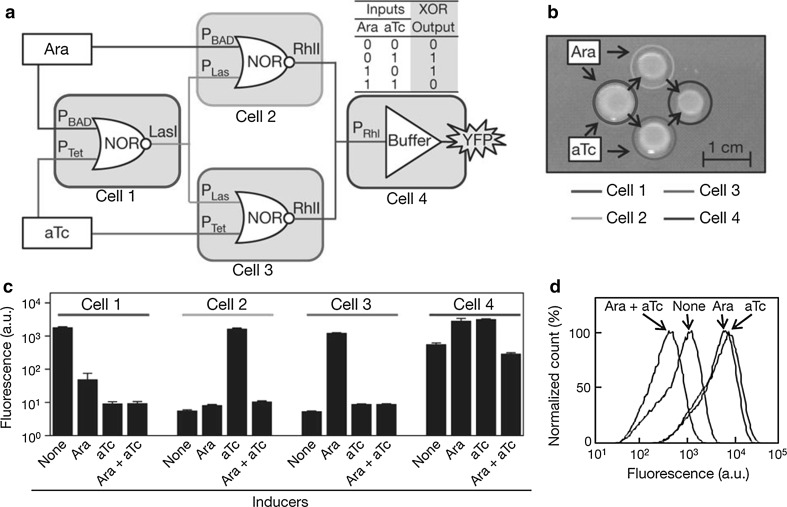
Fig. 5.
Design of XOR gate. a Four colonies, each contains a single gate and spatially arranged on agar plate. Ara and aTc inputs were added in plate. b Spatial arrangement of the colonies. c Each colony responds to the combinations of input signals. Fluorescence values and their error bars were calculated (mean ± SD). d Cytometry data showed for XOR (cell 4). Figure reproduced with permission from Nature (Tamsir et al. 2011) © 2011 Macmillan Publishers Ltd

