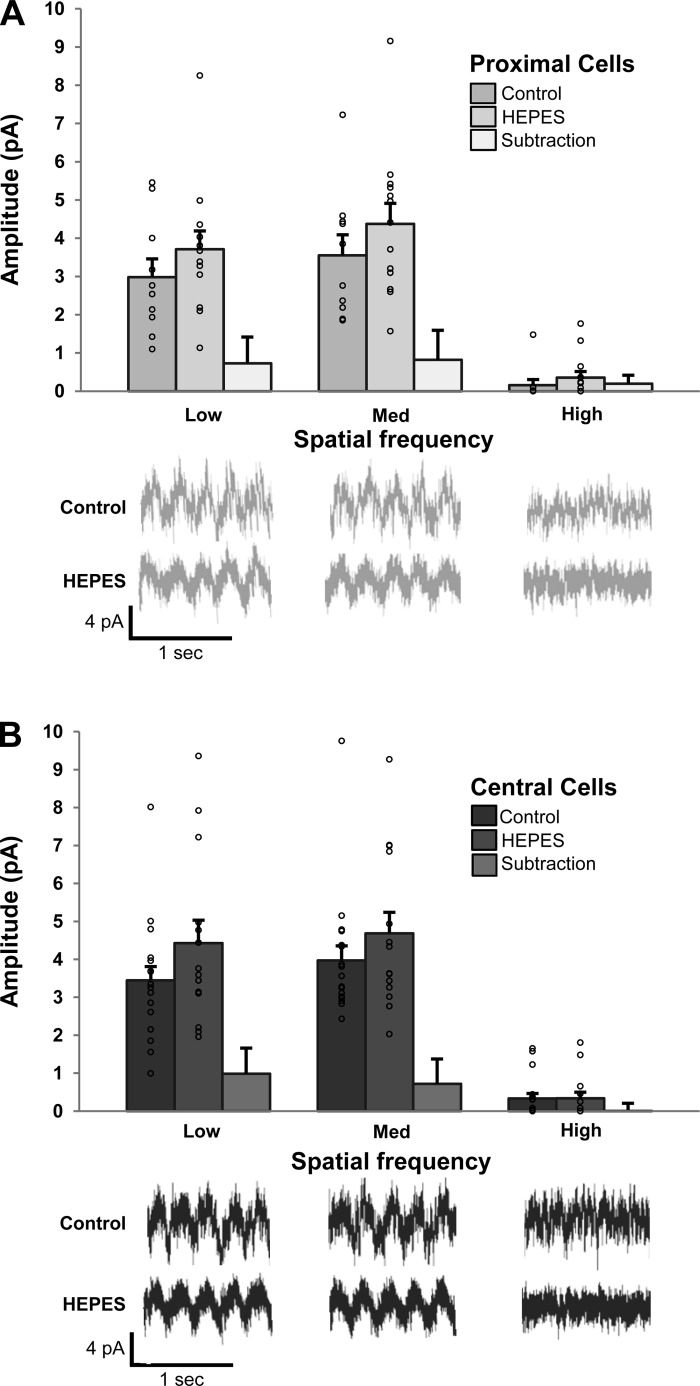
Fig. 3.
Horizontal cell and cone inputs to central and proximal ON CBCs are similar. L-EPSCs were recorded in proximal (A) and central (B) ON CBCs, voltage clamped at ECl. The control and 20 mM HEPES condition measured cone + horizontal and cone inputs, respectively. Horizontal cell input was the subtraction of control and HEPES conditions. No significant differences in horizontal cell or cone input were observed between central and proximal ON CBCs at any spatial frequency. For A and B: open circles correspond to individual proximal (control: n = 10; HEPES: n = 13) and central (control: n = 18; HEPES: n = 14) cells. Sample traces representing control and HEPES conditions at all tested spatial frequencies appear below corresponding regions of summary bar graphs. Error bars for the subtraction data represent standard error of the difference.

