Fig. 4.
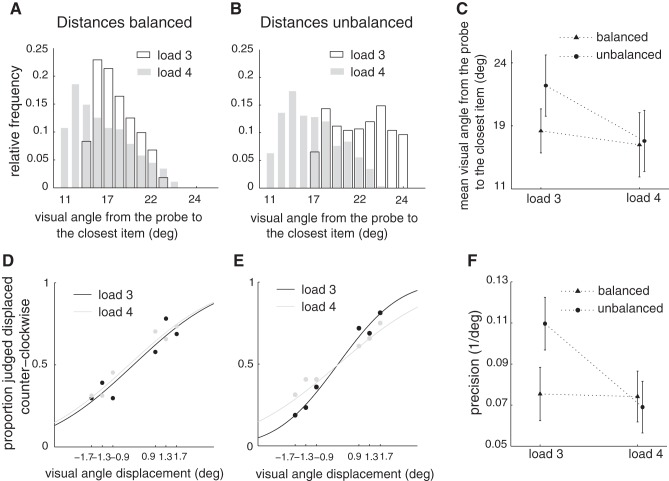
Behavioral data support the model-derived prediction of conditional dependence of precision on load. A and B: histograms of the distances between the target or probed item to the nearest nonprobed item for loads 3 and 4 for the case of balanced or invariant distances across load (A) or for the case of unbalanced or varying distances across load trials (B) (see results). Each combination of load and trial type (balanced/unbalanced) included 384 trials. C: mean distances from the target to the nearest neighbor for loads 3 and 4 and for balanced and unbalanced distances. Error bars indicate SD. D: psychometric curves for loads 3 and 4 for the case of balanced distances. Curves resulted from a probit model fit to data from all participants (n = 8). E: same as in D for unbalanced distances. F: precision derived from D and E decreased with load for unbalanced distances, while it remained unchanged for balanced distances. Error bars indicate SE.

