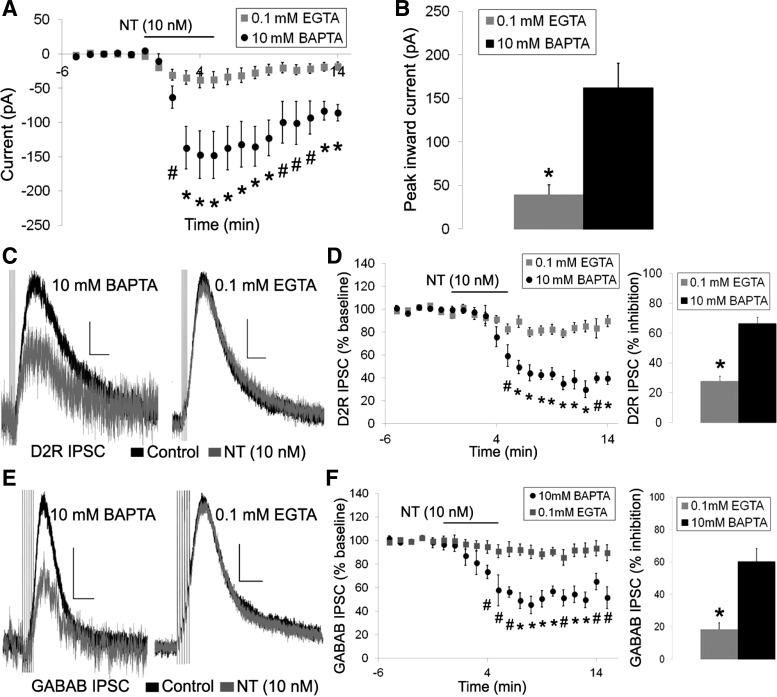
Fig. 9.
Reduced buffering of intracellular calcium attenuates the effects of neurotensin. A and B: mean neurotensin (10 nM)-induced inward current with an internal solution containing 10 mM BAPTA or 0.1 mM EGTA. C–F: sample traces (C and E) and mean effect (D and F) of neurotensin (10 nM; grey trace) on the D2R IPSC (C and D) and GABAB IPSC (E and F) using internal solutions containing 10 mM BAPTA or 0.1 mM EGTA. Bars in A, D, and F indicate time of neurotensin application; n = 5–12 cells from 4–11 mice for each group. Scale bars = 20 pA/400 ms (C) and 20 pA/200 ms (D). #P < 0.05, *P ≤ 0.001.

