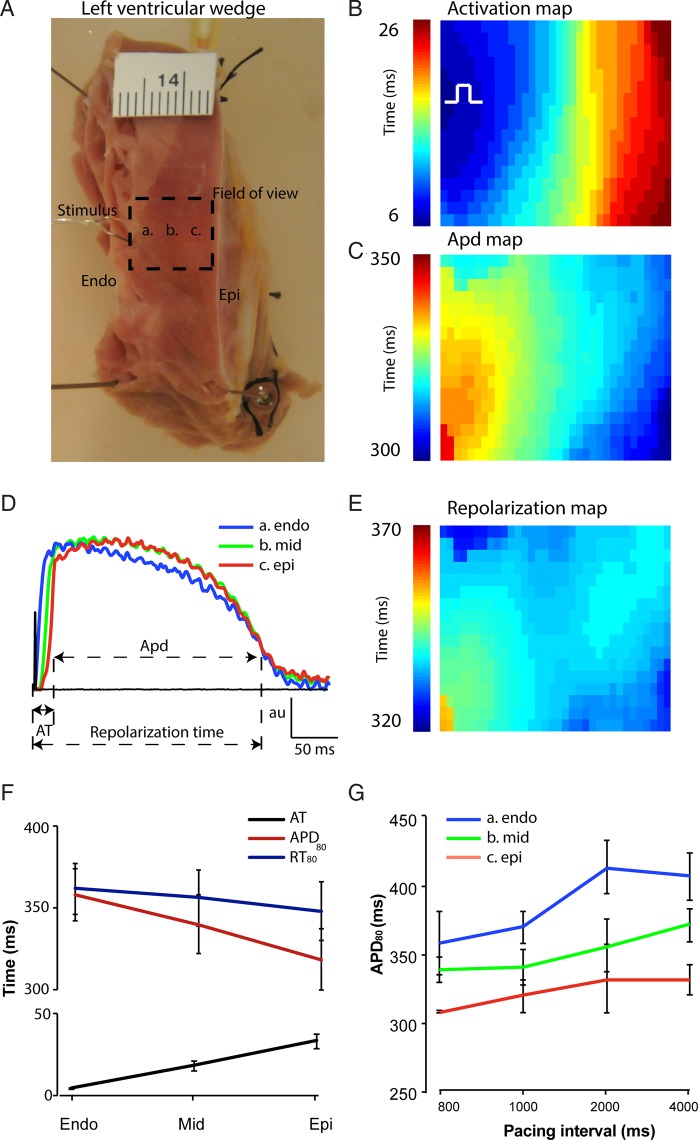
Figure 1.
Gradient in APD and repolarization in the human left ventricular wall. (A) A photograph of a left ventricular tissue preparation. The dashed square represents the field of view and the letters a, b, and c correspond to the subendocardium, midmyocardium, and subepicardium, respectively. The ruler is in centimetres. (B) Activation pattern and (C) action potential gradient during endocardial stimulation within the field of view. The action potentials in (D) correspond to the area indicated by the letters in the photograph of (A). (E) Map shows the reconstructed repolarization gradient during endocardial stimulation. (F) The line graph shows the average APD and the local moment of activation and repolarization in the ventricular wall (n = 10). (G) The bar graph shows the average APD in the ventricular wall duration during different cycle lengths. Endo, subendocardial; Epi, subepicardial.

