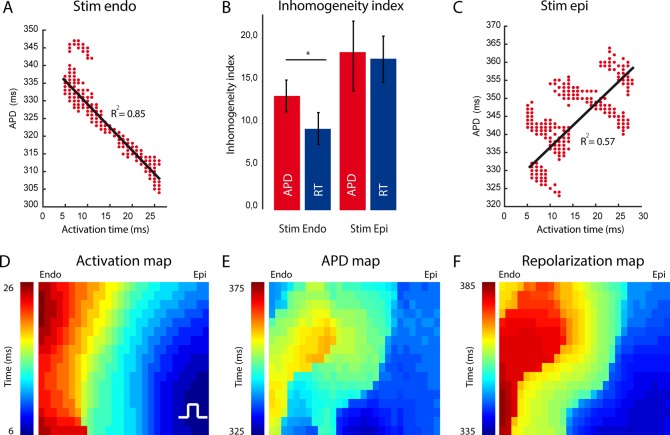
Figure 2.
Relation between AT and APD during endocardial and epicardial stimulation. (A and C) The line graphs show the correlation between AT and APD and repolarization time during endocardial (A) and epicardial stimulation (C) (n = 5). (B) The bar graph shows the inhomogeneity level of APD and RT distribution during endocardial and epicardial stimulation. (D) Activation pattern within the field of view during epicardial stimulation. (E) Action potential gradient. (F) Repolarization pattern during epicardial stimulation. Endo, subendocardial; Epi, subepicardial.

