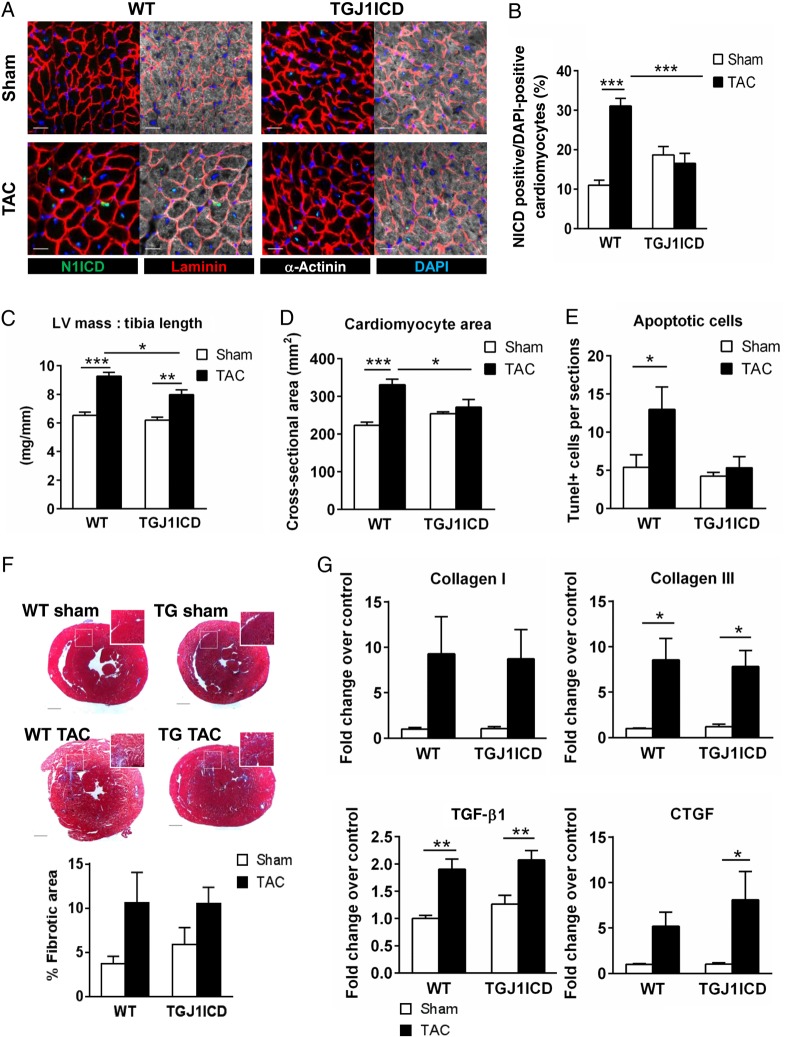
Figure 6.
Attenuated hypertrophic response to pressure overload in adult TGJ1ICD hearts. Adult WT and TGJ1ICD littermates were subjected to TAC or sham operation and were treated with tamoxifen for 1 week. (A) Heart sections were immunostained against NICD (green), laminin (red), and α-sarcomeric-actinin (white). Nuclei were stained with DAPI (blue). Scale bar, 20 µm. (B) The number of NICD-positive cardiomyocytes was quantified. **P ≤ 0.01, ***P ≤ 0.001 vs. control or vs. indicated values. (C) LV mass normalized to tibia length in TAC or sham operated WT and TGJ1ICD mice. (D) Cross-sectional areas of ≥3000 myocytes per group were measured on laminin-stained heart sections. (E) Number of TUNEL-positive cells per heart sections. (F) Top, Masson Trichrome staining. Scale bars, 2 mm. Bottom, the fibrotic area was quantified and expressed as the percentage of the total section area. (G) Quantitative RT-PCR analysis of fibrosis markers. Results, normalized to Gapdh, represent fold change relative to WT sham. (B–G) Bar graphs are mean ± SEM (n = 6–7 mice per group; *P ≤ 0.05; ***P ≤ 0.01 vs. indicated values).

