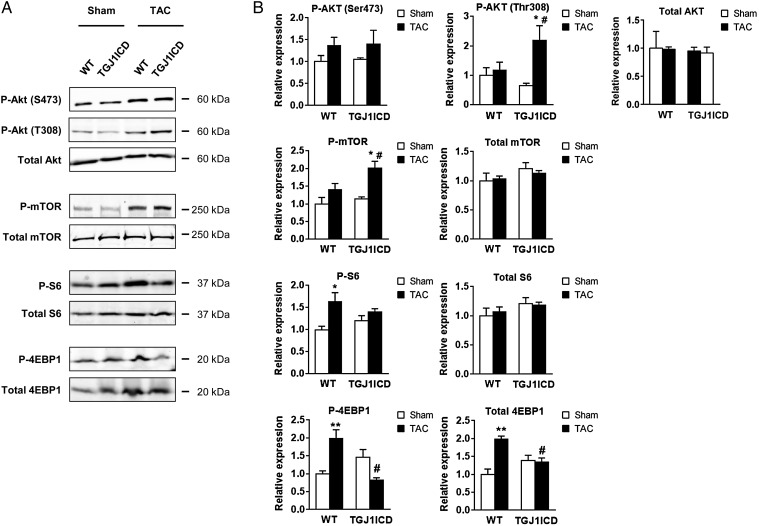
Figure 7.
Crosstalk between J1ICD signalling and the AKT pathway. (A) Phosphorylated and total AKT, mTOR, S6, and 4EBP1 were analysed by western blot in adult WT and TGJ1ICD mice subjected to TAC or sham operation and treated with tamoxifen for 1 week. (B) Immunoblots were quantified. Bar graphs represent the ratio of the phosphorylated to total signals normalized to the WT sham group (n = 3–6 mice per group; *P ≤ 0.05; **P ≤ 0.01 vs. WT sham; #P ≤ 0.05 vs. WT TAC).

