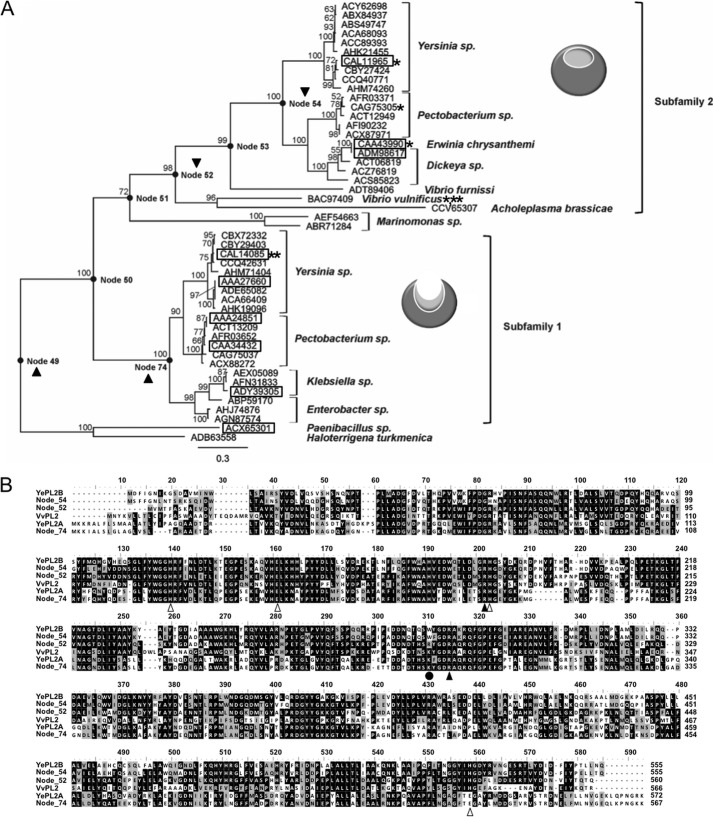
FIGURE 4.
Ancestral sequence reconstruction of the PL2 family. A, phylogeny of the PL2 family with calculated ancestor sequence nodes highlighted (●) and labeled. The node sequences (49, 52, 54, and 74) that were targeted for gene synthesis and biochemical characterization are indicated with a black triangle. Previously characterized enzyme activities are boxed, activities reported in this study are noted with a single asterisk (see Table 1 for references), and family members with solved three-dimensional structures are designated with a double asterisk (3). B, primary structure alignment of YePL2A, YePL2B, VvPL2, Node 52, Node 54, and Node 74. Residues involved in catalysis and metal coordination are indicated with black and white triangles, respectively. The putative lysine to tryptophan switch is highlighted with a black circle.

