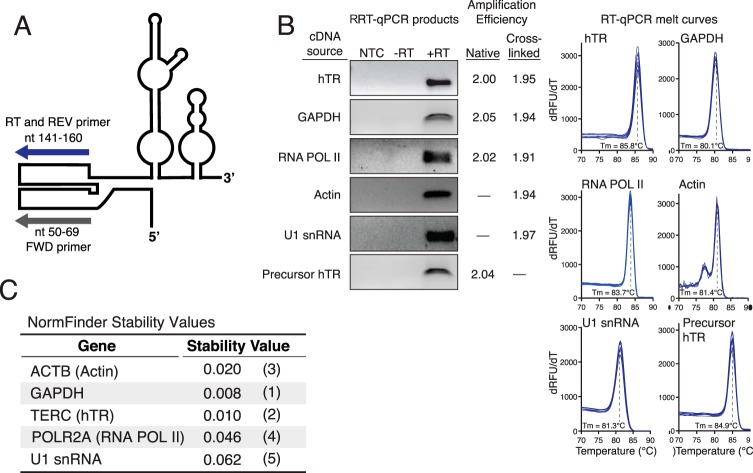
FIGURE 3.
Characterization of RT-PCR products for hTR and reference genes. A, schematic of hTR and RT-qPCR primers used for hTR cDNA generation and PCR amplification. B, RT-qPCR of hTR and normalization standards generates single products (+RT lane) and homogenous melt curves (n = 8) shown for RNA from native cell extract. PCR amplification efficiencies were measured using the LinReg program for samples from the relevant cell extract without or with in vivo cross-linking. No template control (NTC) samples lacked RNA template, and −RT lanes lacked reverse transcriptase. C, potential reference genes for cell cycle RT-qPCR measurements were compared using the NormFinder program. NormFinder stability values and rankings are shown in parentheses. GAPDH mRNA and hTR levels were the most consistent over the cell cycle.

