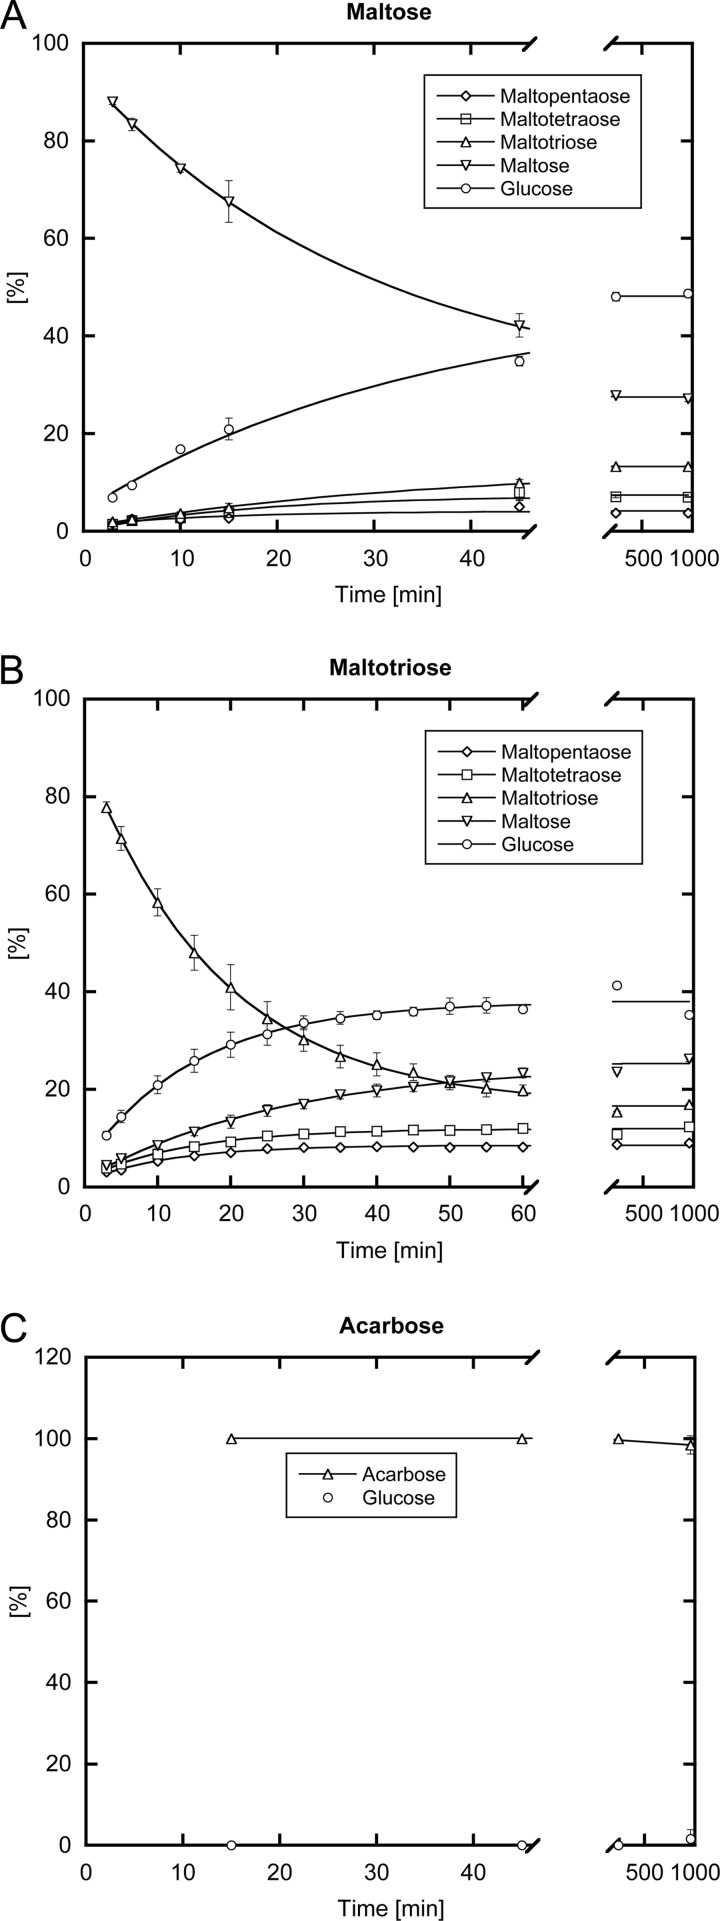
FIGURE 6.
MalQ enzymatic assay. Evolution of maltodextrin product concentrations including glucose, maltose, maltotriose, maltotetraose, and maltopentaose starting from the substrates maltose (A) and maltotriose (B) are plotted over time. C, illustrates the very slow conversion of acarbose by MalQ. The product mixtures were derivatized with dansylhydrazine, separated by HPLC and their relative peak areas were quantified.

