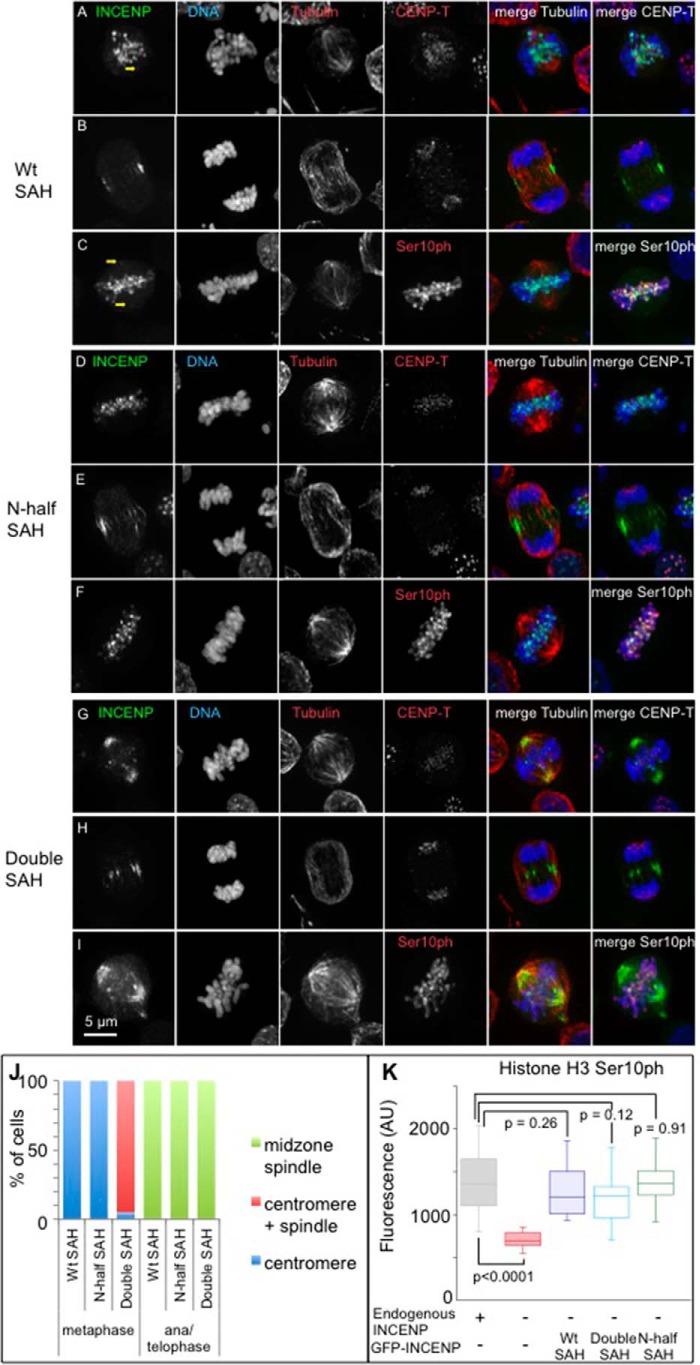
FIGURE 3.
Localization of various INCENP SAH mutants. Micrographs of cells from stable cell lines expressing GFP-TrAP-INCENPWT SAH (A–C), GFP-TrAP-INCENPN-half SAH (D–F), and GFP-TrAP-INCENPDouble SAH (G–I) are shown. INCENP is shown in green, DNA is shown in blue, and tubulin or CENP-T is shown in red. Yellow arrows point to the faint GFP signal of GFP-TrAP-INCENPWT SAH around centrosomes. Scale bar, 5 μm. J, quantification of localization of various INCENP mutants. Twenty cells were counted for each sample. The average of two independent experiments is shown. K, quantification of histone H3 Ser10 phosphorylation status of various INCENP mutants in 12–20 cells each at prometaphase. p values were calculated based on Student's t test with unpaired variants. AU, absorbance units.

