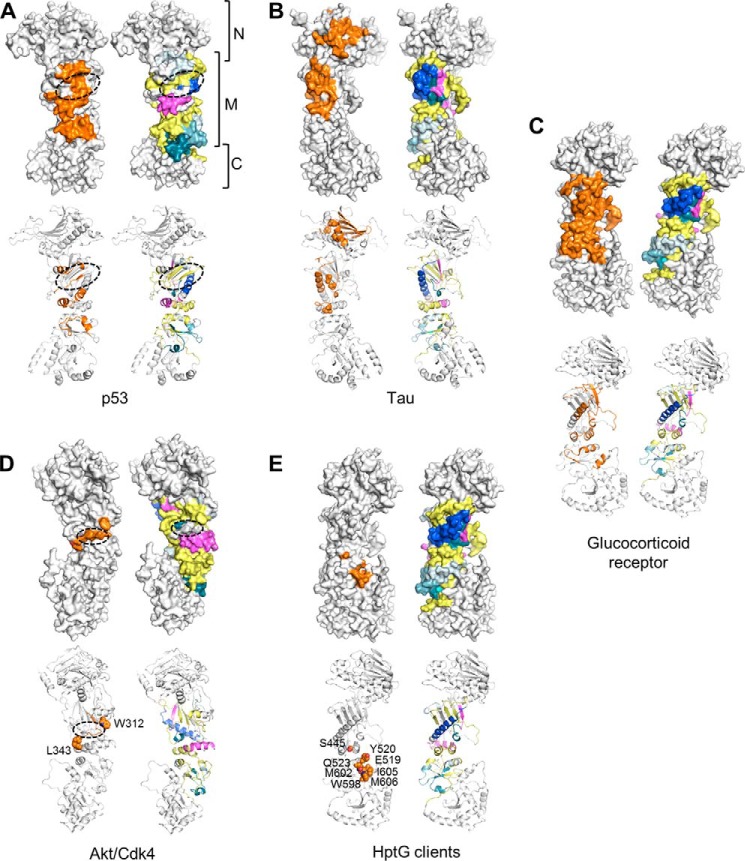
FIGURE 10.
Comparison with other hsp90-client protein interactions. Surface and schematic representations of hsp90 monomers are shown for each comparison. Residues implicated in client binding are colored orange. For comparison, an hsp90 monomer colored as described in Fig. 5 (depicting areas affected by complexation with sGCβ1(1–359)-H105F) is shown for each client interaction. A, putative hsp90-interaction surface of p53 DNA-binding domain. The dashed oval indicates a putative binding groove for several loops of the p53 DNA-binding domain (50) formed by one side of β9 and elements from helices α6, α7, and α8. B, distributed interaction surface of Tau protein on N and M domains of hsp90 identified by mutagenesis, NMR, and small angle x-ray scattering data (66). C, putative interaction surface of glucocorticoid receptor ligand-binding domain identified by NMR, mutagenesis, and cryo-EM data (10, 11). D, putative kinase-interacting epitopes of hsp90. Dashed oval indicates location of an Akt/PKB-interacting loop (65) connecting strands β10 and β11. Residues Trp-312 and Leu-343, shown as spheres, are implicated in binding of kinases such as CDK4, which are cochaperoned by cdc37 (55). E, residues on C-terminal half of M domain and C domain corresponding to client-binding residues on E. coli HptG (13, 53). Residues are shown as spheres.

