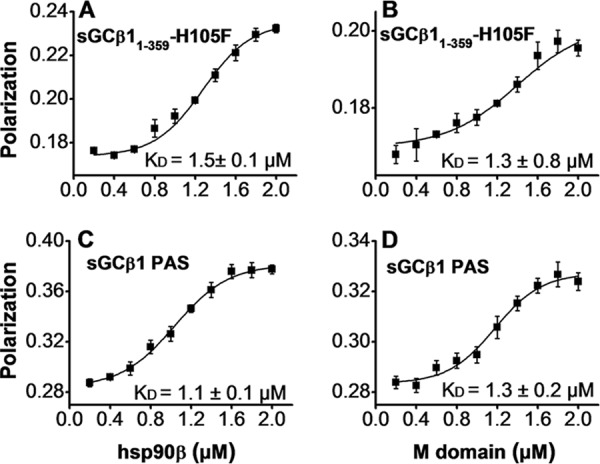
FIGURE 4.

Titrations to determine binding affinities of the four principal interactions. A–D, each indicated FITC-labeled protein (0.2 μm) was titrated with the indicated concentrations of hsp90β or the M domain in a Flexstation instrument, and the residual polarized fluorescence was plotted and fit to determine the apparent KD value of each interaction (mean ± S.D., n = 3, written in each panel).
