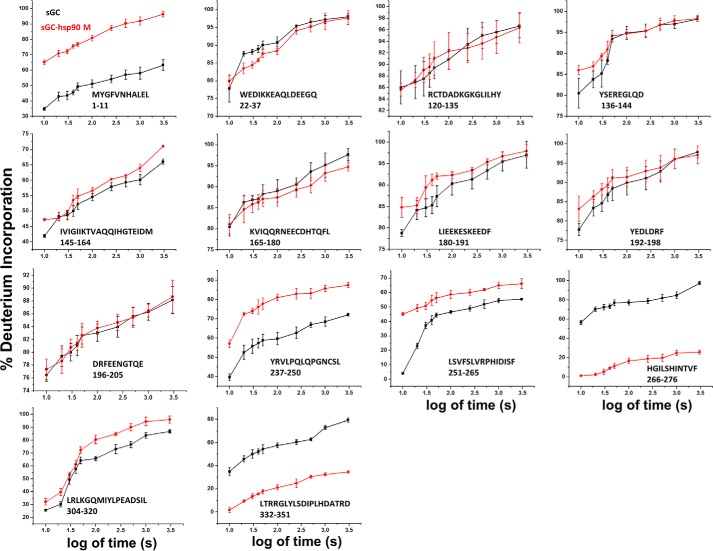
FIGURE 8.
Kinetic traces of deuterium exchange on sGCβ1(1–359)-H105F. Plots show the time dependence of deuterium incorporation (as a percentage of full deuterium incorporation) in sGCβ1(1–359)-H105F alone (black) or preincubated with hsp90β M domain (red). Values represent the mean ± S.D. for three experiments.

