
FIGURE 8.
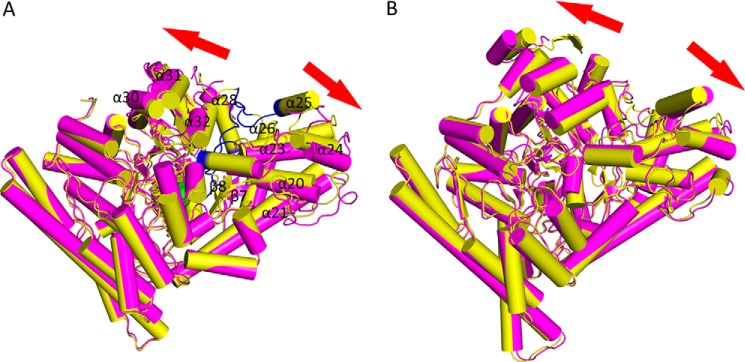
A, choline-bound (yellow) and native (purple) CutC forms. Regions present in the choline-bound form but absent in the native form electron density map are colored in blue. Choline is displayed as a sphere model, with green carbon atoms and red oxygen atoms. B, BSS α subunit, BSSαβγ (yellow), and BSSαγ (purple) (13). Images were created with PyMOL.