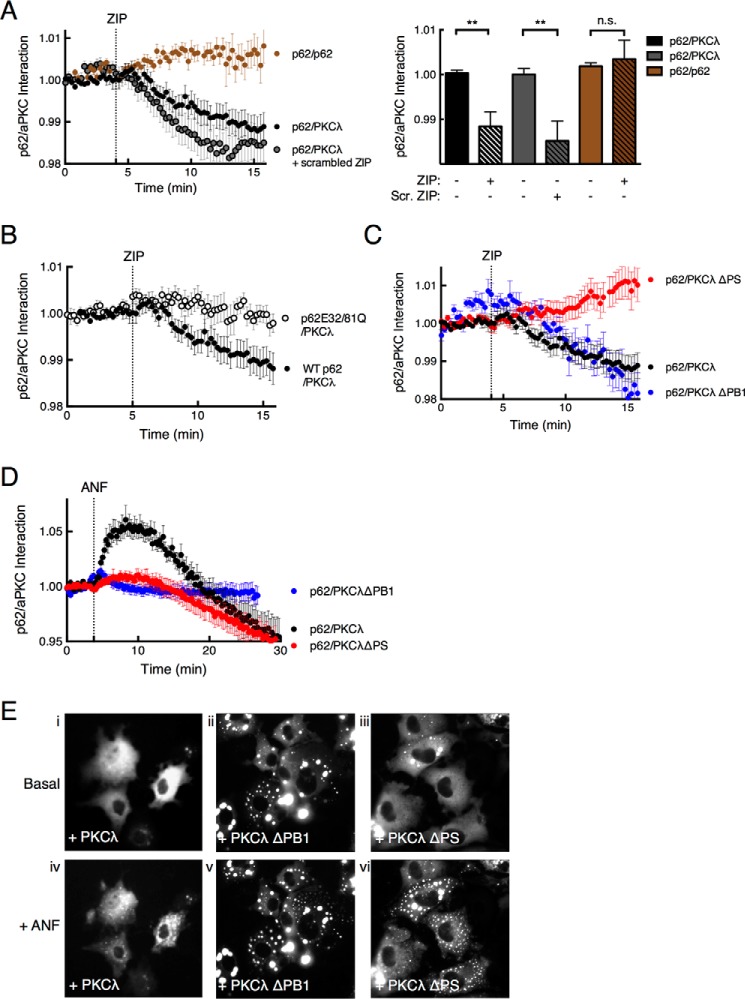
FIGURE 3.
ZIP disruption of p62/aPKC complex requires an intact pseudosubstrate segment. A, the ability of ZIP to disrupt the p62/PKCλ complex was assessed by monitoring real-time FRET between fluorescent pair CFP and YFP using live cell imaging. The FRET/CFP ratio of COS-7 cells co-expressing CFP-p62 and YFP-PKCλ (black circles, n = 26) or YFP-p62 as control (brown circles, n = 13) was monitored before and after treatment with 5 μm ZIP or scrambled ZIP (Scr. ZIP) (gray circles, n = 24). Data were plotted as a p62-aPKC interaction and represent the normalized FRET/CFP ratio mean ± S.E. of the indicated number of cells from at least 3 independent experiments. The graph shows the ratio values immediately prior to ZIP treatment (basal) and 10 min past treatment (+ ZIP) analyzed by paired Student's t test: n.s., no significance; *, p < 0.05; **, p < 0.01. B, FRET/CFP ratio changes were monitored as in panel A for COS-7 cells co-expressing YFP-PKCλ and either CFP-tagged wild-type p62 (black circles, n = 26) or a construct in which Glu32 and Glu81 were mutated to Gln (p62E32/81Q; open circles, n = 24); cells were treated with 5 μm ZIP. C, FRET/CFP ratios were monitored for COS-7 cells expressing CFP-p62 and YFP-PKCλ ΔPS (red circles, n = 31), PKCλ ΔPB1 (blue circles, n = 12), or full-length YFP-PKCλ (black circles, n = 26). D, FRET/CFP ratios were measured for COS-7 cells expressing CFP-p62 and YFP-PKCλ (black circles, n = 15), YFP-PKCλ ΔPS (red circles, n = 16), or CFP-PKCλ ΔPB1 (blue circles, n = 15) before and after treatment with 10 μm ANF. E, fluorescence micrographs of COS-7 cells showing the localization of CFP-tagged p62 co-expressed with PKCλ (panels i and iv), PKCλ ΔPB1 (panels ii and v), or PKCλ ΔPS (panels iii and vi) before or after 1 h ANF treatment.

