FIGURE 3.
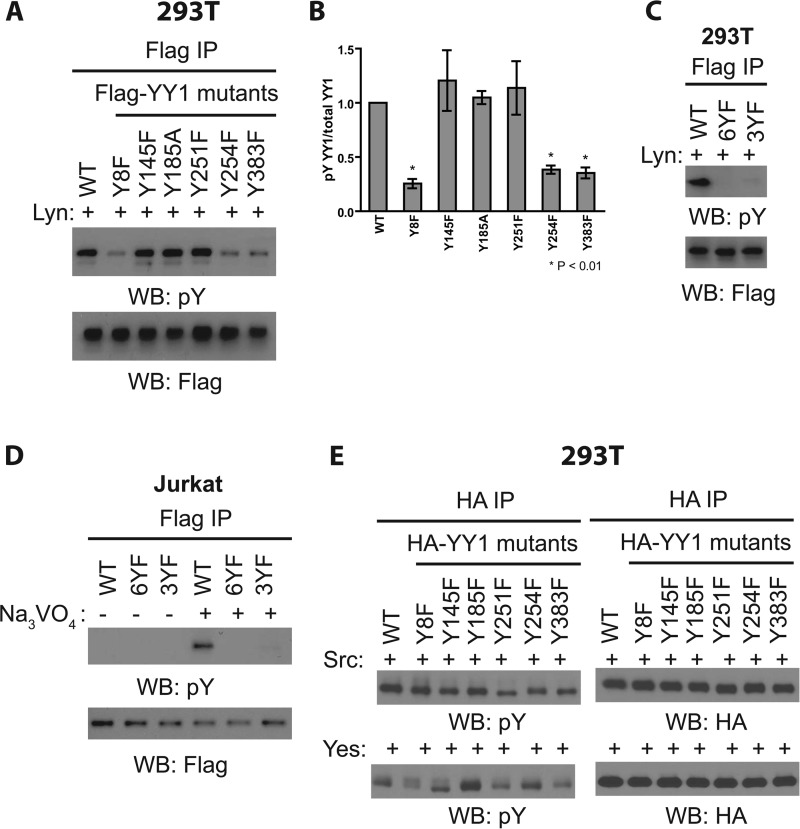
Characterizing the sites of YY1 phosphorylation. A, cell lysates prepared from HEK-293T cells transfected with GFP-Lyn together with WT or nonphosphorylatable FLAG-YY1 mutants for 48 h were subjected to immunoprecipitation (IP) with anti-FLAG antibody and Western blotting (WB) as indicated. Data shown are representative of three independent experiments. B, densitometry measurements of the levels of tyrosine-phosphorylated YY1 (pY) normalized to total YY1 (pY YY1/total YY1, y axis) as shown in Fig. A. Results shown are the means ± S.E. from three independent experiments. Student's t test was used for statistical analysis. * denotes p < 0.01 with respect to wild-type YY1. C, similar experiment as A using Y8F, Y254F, Y383F (3YF) triple nonphosphorylatable YY1 mutant and YY1 mutant in which all six tyrosines were mutated to phenylalanine (6YF). Data shown are representative of three independent experiments. D, Jurkat cells were transfected with wild-type or nonphosphorylatable FLAG-YY1 mutants for 48 h before pervanadate treatment followed by cell lysis, immunoprecipitation with anti-FLAG antibody, and Western blotting as indicated. Data shown are representative of three independent experiments. E, cell lysates prepared from HEK-293T cells transfected with FLAG-Src or FLAG-Yes together with WT or nonphosphorylatable HA-YY1 mutants for 48 h were subjected to immunoprecipitation with anti-HA antibody and Western blotting as indicated. Data shown are representative of two independent experiments.

