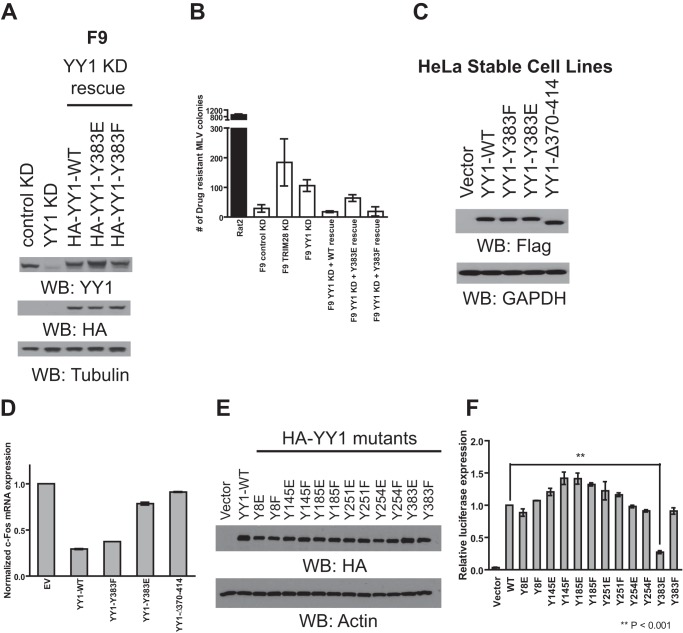
FIGURE 4.
Functional analysis of YY1 phosphorylation mutants using retroviral and cellular readouts. A, lysate prepared from F9 cells stably transduced with either control shRNA or YY1-specific shRNA were subjected to Western blotting (WB) as indicated (left two). To rescue YY1 expression, YY1-shRNA knockdown cells were stably transduced again with either HA wild type, Y383E, or Y383F YY1, and lysates from these cells were subjected to Western blotting as indicated (third to fifth lanes). B, Rat2 and various F9 knockdown (KD) cell lines were infected with VSV-G-pseudotyped MLV particles carrying the Zeocin resistance gene under the control of the MLV promoter. Reporter gene expression in each cell line was assessed by colony counting after Zeocin selection. The graph shows the number of Zeocin-resistant colonies after drug selection. Results shown are the means ± S.D. from two independent experiments performed in triplicate. C, lysate prepared from HeLa cells stably transduced with retroviral expression vectors containing wild-type or mutant YY1 were subjected to Western blotting as indicated. D, total RNA prepared from HeLa cells outlined in Fig. 4C was subjected to quantitative RT-PCR using the indicated primers. Levels of c-fos transcripts were first normalized using the 2−ΔΔCT method to the value obtained for the β-actin gene; the obtained values were then normalized to the values obtained from HeLa cells stably transduced with vector control (set to 1). Results shown are means ± S.D. from two independent experiments performed in duplicate. E, cell lysates prepared from HEK-293A cells transfected with HA-tagged wild type or mutant YY1 were subjected to Western blotting as indicated. F, HEK-293A cells were transfected with a combination of three plasmids, empty vector or various YY1 mutants, HTLV-1 LTR firefly luciferase, and HSV-TK renilla luciferase control plasmid. Twenty-four hours later the activity of the HTLV-1 promoter was determined by dual luciferase assay. Relative luciferase expression was calculated by first dividing the firefly luciferase signal by the renilla luciferase signal in a given cell, and the resulting ratio was then normalized to the ratio obtained from wild-type YY1-transfected cells (set to 1). Results shown are the means ± S.E. from four independent experiments performed in duplicates. Student's t test was used for statistical analysis. ** denotes p < 0.001.

