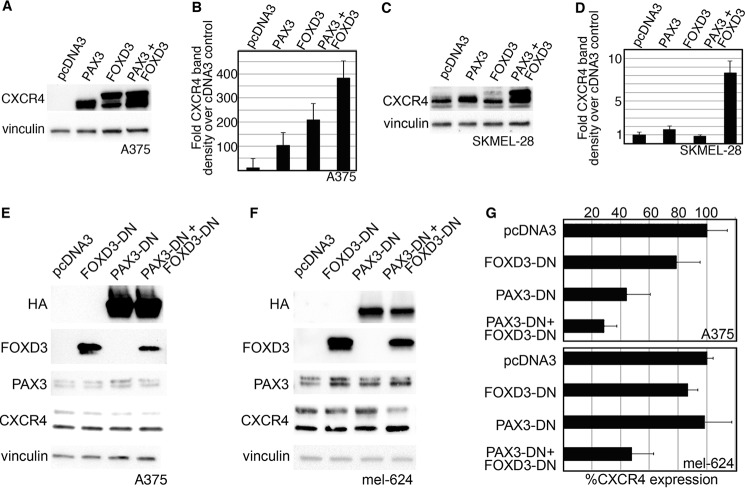
FIGURE 7.
PAX3 and FOXD3 are sufficient to overexpress CXCR4 protein in melanoma cells, and PAX3 with or without FOXD3 is necessary for full CXCR4 expression. A–D, the addition of exogenous PAX3 and FOXD3 in A375 (A and B) or SKMEL-28 (C and D) cells leads to an increased level of CXCR4 protein. In A375 cells, endogenous CXCR4 is expressed in multifold lower levels in comparison to transfected cells and is not detectable at the exposure presented in A. A representative Western analysis is shown (A and C), and densitometry of four independent experiments are displayed in graph form (B and D). PAX3, FOXD3, or both proteins together were able to overexpress significant levels of CXCR4 protein in A375 cells (B, p < 0.002 all groups), whereas only the expression of both PAX3 and FOXD3 overexpressed CXCR4 at significant levels in SKMEL-28 (D, p < 0.0005 PAX3 + FOXD3 group). E–G, the inhibition of PAX3, or PAX3 and FOXD3, leads to a reduction of CXCR4 protein. Dominant-negative proteins shown in Fig. 6 are transfected into A375 (E) or mel-624 (F) cells. Exogenous PAX3-DN protein is detected by the HA tag, whereas endogenous PAX3 levels are revealed using an antibody that recognizes the C terminus that is lacking in the PAX3-DN. Endogenous FOXD3 levels are expressed at significantly lower levels in comparison to FOXD3-DN protein and is not detectable at the exposure shown in E and F. A representative Western analysis is shown (E and F), and densitometry of four independent experiments are displayed in graph form (G). Significant decreases in CXCR4 was seen when PAX3-DN alone (44.7 ± 16.5% of control levels, p = 0.006) or with PAX3-DN and FOXD3-DN together (28.4 ± 9.2%, p = 0.009) were added to A375 cells (top graph), or both dominant-negative proteins in mel-624 cells (47.8 ± 15.4%, p = 0.002, bottom graph). Decrease in CXCR4 intensity was predominantly seen in the slower migrating 52-kDa band.

