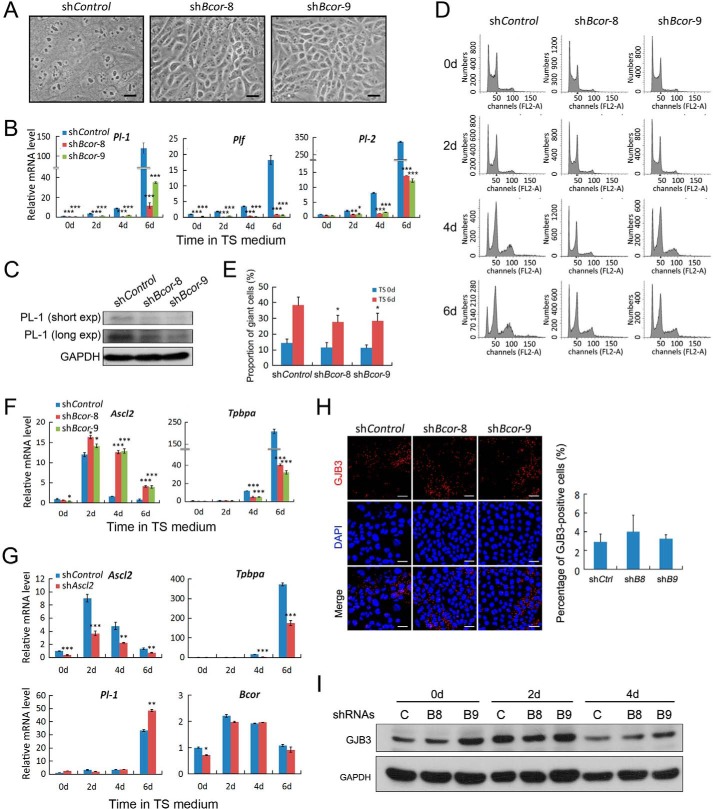
FIGURE 5.
Bcor is required for trophoblast giant cell differentiation. A, representative images showing the morphology of shControl, shBcor-8, and shBcor-9 TSCs after 4 days of differentiation in TS medium. Scale bars represent 250 μm. B, cells were cultured in TS medium to allow differentiation for the indicated time points. The mRNA levels of the trophoblast giant cell markers Pl-2 and Plf were determined by qRT-PCR. C, PL-1 protein was detected using immunoblotting after 6 days of differentiation in TS medium. short exp, short exposure; long exp, long exposure. D and E, cells were cultured in TS medium for 0, 2, 4, and 6 days, respectively, and the cellular DNA content was measured by FACS (D). The percentages of cells with DNA content ≥ 8n in day 6 are shown in the bar graph (E). F, cells were cultured in TS medium to allow differentiation for the indicated time points. The mRNA levels of the spongiotrophoblast markers Ascl2 and Tpbpa were determined by qRT-PCR. G, TSCs expressing control or Ascl2 shRNAs were cultured in TS medium to induce differentiation for 0, 2, 4, and 6 days, respectively, and then they were collected for qRT-PCR analysis to determine the expression of the lineage markers and Bcor. H, cells were differentiated in TS medium for 4 days and harvested for anti-GJB3 immunostaining. Scale bar: 50 μm. I, cells differentiated in TS medium for the indicated time points were harvested for anti-GJB3 immunoblotting. C, shControl; B8, shBcor-8; B9, shBcor-9. Data are presented as mean ± S.E. (n = 3; ***, p < 0.001; **, p < 0.01; *, p < 0.05).

