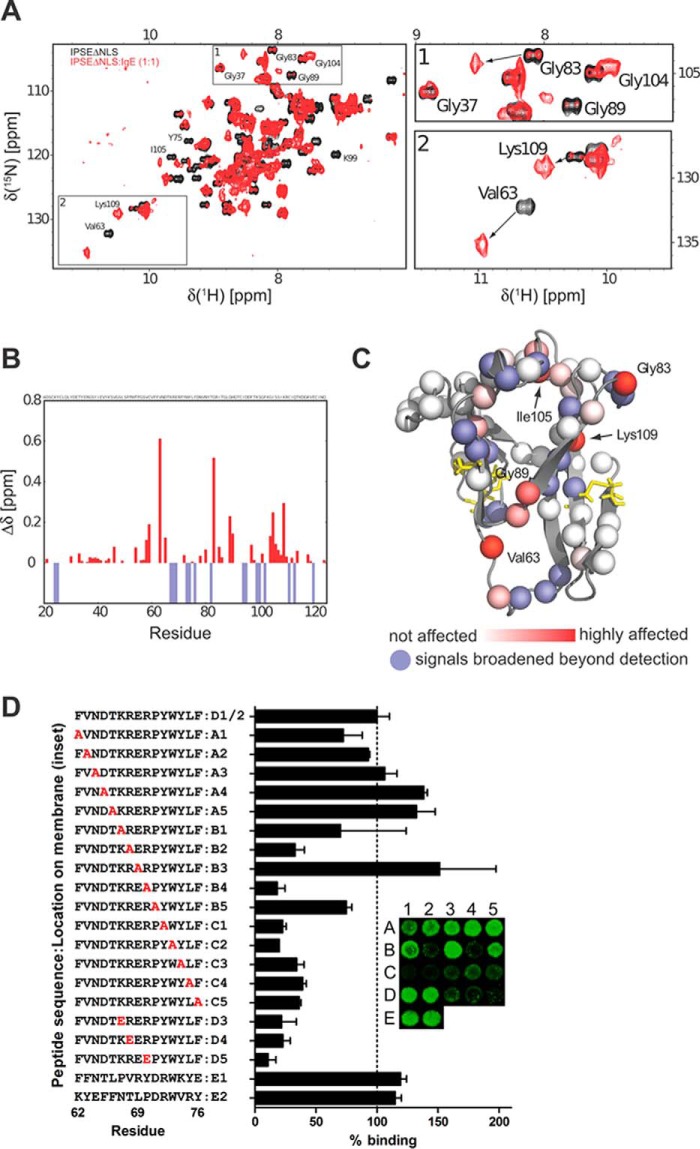
FIGURE 7.
Mapping the binding surface of IPSEΔNLS with IgE. A, 1H,15N NMR correlation spectra of IPSEΔNLS (black) and the IPSEΔNLS·IgE complex (molecular mass ∼200 kDa, red). The presence of NMR signals corresponding to free IPSEΔNLS at a molar ratio of ∼1:1 (IPSEΔNLS/IgE) suggests that IgE has only one IPSEΔNLS-binding site. (Note, the NMR signals of even a very small fraction of free IPSEΔNLS (10 kDa) are much stronger than those of the 200-kDa complex.) B, NMR chemical shift perturbation (CSP) versus residue number. Blue negative bars indicate amide signals that are broadened beyond detection. C, mapping of the IgE binding interface onto the structure of IPSEΔNLS. Nitrogen atoms of the backbone amide groups are represented as spheres and colored red according to CSP or blue if line broadening is observed in the NMR titration experiment. D, peptide scan. Binding of labeled IgE was to immobilized 15-mer IPSE-derived peptides. Binding (means ± S.E.) of IgE-DY781 to 15-mer peptides is expressed in relation to the IPSE-derived peptide 62–76 (inset, spots D1 and D2; mean fluorescence = 100%). Residues exchanged to Ala or Glu in the respective peptides are highlighted in red. Inset, representative example of a peptide library read-out.

