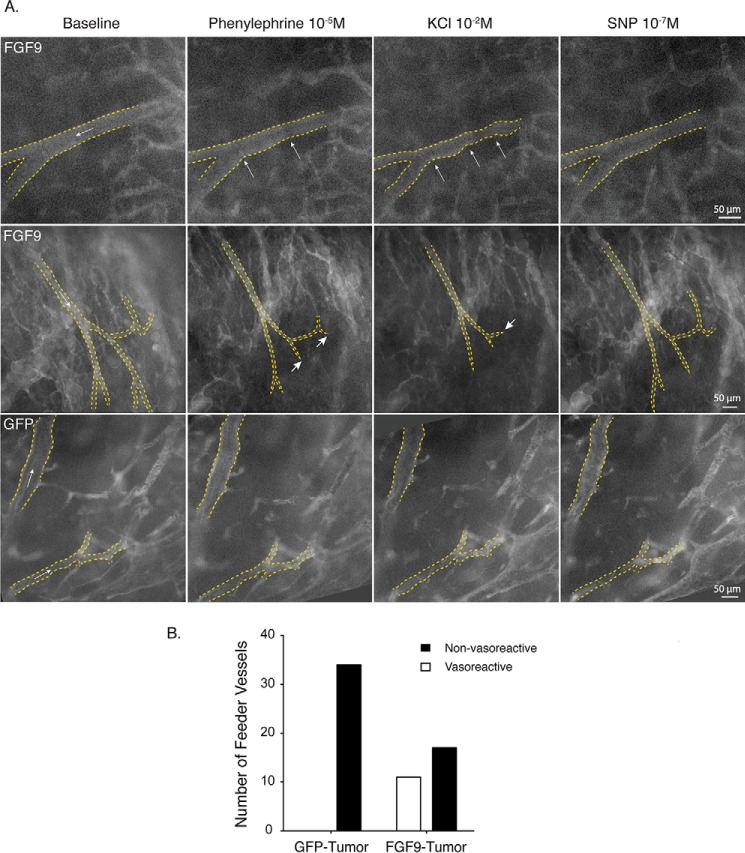
FIGURE 5.
FGF9 imparts tumor vessels with vasoreactivity. A, intravital microscopy images of vessels within orthotopic renal tumors 10 days after injection of Renca cells, imaged live by intravital microscopy following injection of FITC-labeled dextran. Images depict the vascular lumen before and after subfusion of phenylephrine (10−5 m), KCl (10−2 m), and SNP (10−7 m), for a minimum of 3 min as indicated. Arrows within the lumen depict the direction of flow. Top panel, vessel within an FGF9-expressing tumor showing focal vasoconstriction (arrows) in response to phenylephrine subfusion, and both focal and diffuse constriction following KCl subfusion. The lumen diameter widens after subfusion with SNP. Middle panel, vessels within an FGF9-expressing tumor showing flow down a network with progressively smaller branches. Following phenylephrine subfusion, diffuse vessel constriction can be seen as well as complete cessation of flow in some of the distal vessel branches (short arrows). This is accompanied by a loss of fluorescence signal throughout the tumor, indicating widespread reduction in tumor perfusion. Diffuse vessel constriction, cessation of flow in distal vessels (short arrow), and generalized hypoperfusion are even more pronounced following KCl administration. These changes are partially reversed following delivery of SNP. Bottom panel, vessels within a GFP-expressing tumor showing no change in luminal diameter or flow indicators following delivery of vasomotor agents. B, plot of all vessels segments imaged, 20–70 μm in diameter and with continuous flow into progressively smaller branches, which displayed vasoreactivity. n = 34 and 28 vessels in GFP- and FGF9-expressing tumors, respectively. p = 0.0085. Movie corresponding to the middle row of images in panel A can be seen in supplemental Video S5.

