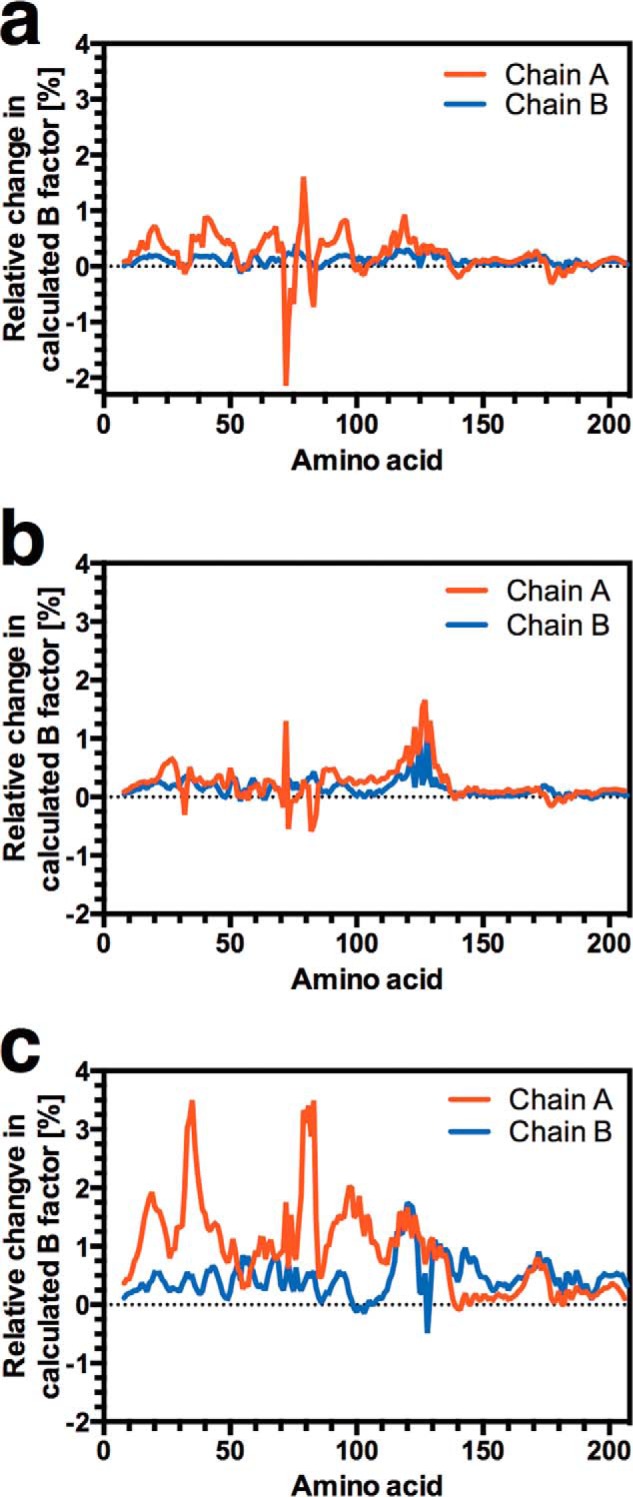
FIGURE 2.

Mapping local dynamics in CAP. The effect of mutation of Gly-71/Glu-72 (a), Arg-82/Ser-83 (b), and Thr-127/Ser-128 (c) on local dynamics over the CAP monomer. The chart represents the percentage variation in the calculated B-factor from the wild type curated ENM plotted against amino acid number. The ENMs represent the single ligand-bound state with one molecule of cAMP bound to chain A.
