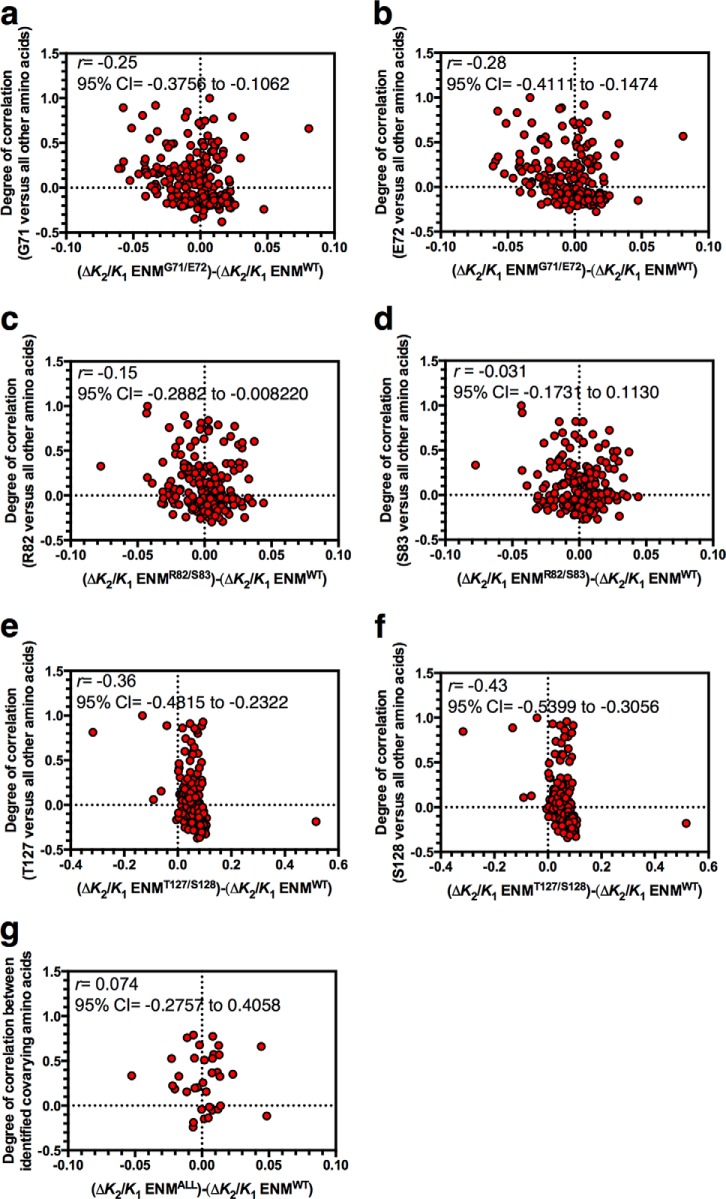
FIGURE 6.
Correlations between allostery and motion in CAP. The y axes of all charts show the degree of correlated motion between a particular cAMP-contacting residue and every other amino acid in the CAP monomer. The x axes of all charts show the change in allosteric cooperativity induced by individual mutation of every amino acid in ENMWT (ΔK2/K1 ENMWT) subtracted from the change in allosteric cooperativity induced by the same mutation in the ENM with paired mutations in cAMP-contacting residues identified in Fig. 1D (ENM named as per Fig. 5). a, correlated motion between Gly-71 and all other amino acids plotted against ΔK2/K1 ENMWT subtracted from ΔK2/K1 ENMG71/E72. b, correlated motion between Glu-72 and all other amino acids plotted against ΔK2/K1 ENMWT subtracted from ΔK2/K1 ENMG71/E72. c, correlated motion between Arg-82 and all other amino acids plotted against ΔK2/K1 ENMWT subtracted from ΔK2/K1 ENMR82/S83. d, correlated motion between Ser-83 and all other amino acids plotted against ΔK2/K1 ENMWT subtracted from ΔK2/K1 ENMR82/S83. e, correlated motion between Thr-127 and all other amino acids plotted against ΔK2/K1 ENMWT subtracted from ΔK2/K1 ENMT127/S128. f, correlated motion between Ser-128 and all other amino acids plotted against ΔK2/K1 ENMWT subtracted from ΔK2/K1 ENMT127/S128. g, correlated motion between 35 covarying residue pairs with at least one cAMP-contacting residue from an alignment of CAP variants plotted against ΔK2/K1 ENMWT subtracted from ΔK2/K1 for the appropriate ENM for that cAMP-contacting residue (ΔK2/K1 ENMALL). All analysis has been performed for chain A of the fully cAMP bound ENM.

