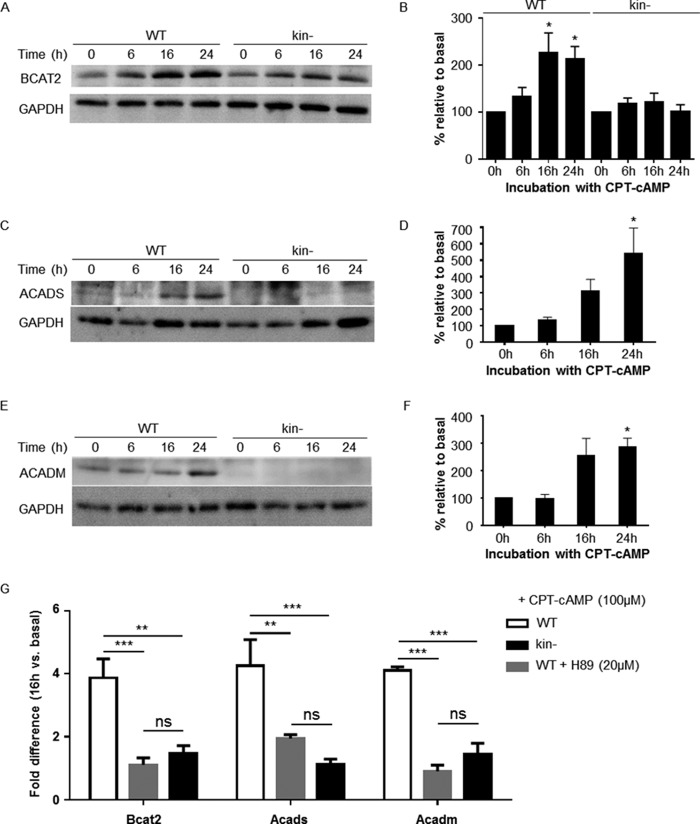
FIGURE 2.
PKA-dependent increases in protein and gene expression of BCAA degradation pathway members in WT S49 cells. Immunoblotting of whole-cell lysates shows that protein levels of Bcat2, Acads, and Acadm increase in WT S49 cells after treatment with CPT-cAMP. Representative immunoblots of Bcat2, Acads, and Acadm are shown in A, C, and E, respectively. B, quantification of Bcat2 protein in WT and kin− S49 incubated with CPT-cAMP. Data shown are the mean ± S.E. of n = 33, * = p < 0.05 versus 0 h. D, quantification of Acadm protein in WT. Data shown are the mean ± S.E. of n = 4 * = p < 0.05 versus 0 h. F, quantification of Acads protein in WT. Data shown are the mean ± S.E. of n = 4. * = p < 0.05 versus 0 h. G, CPT-cAMP induces mRNA expression of Acads, Acadm, and Bcat2 at 16 h incubation time 2-fold over basal expression. H89 blunts the CPT-cAMP-induced expression of Acads, Acadm, and Bcat2. WT, kin−, and WT S49 cells preincubated with 20 μm H89 were treated with CPT-cAMP, and expression of Acads, Acadm, and Bcat2 at 16 h were determined; the results are expressed as relative to expression at 0 h. Data shown are the mean ± S.E., n = 3, p values from Tukey multiple comparisons test after two-way analysis of variance: ** = p < 0.01 versus WT, *** = p < 0.001. ns, not significant.

