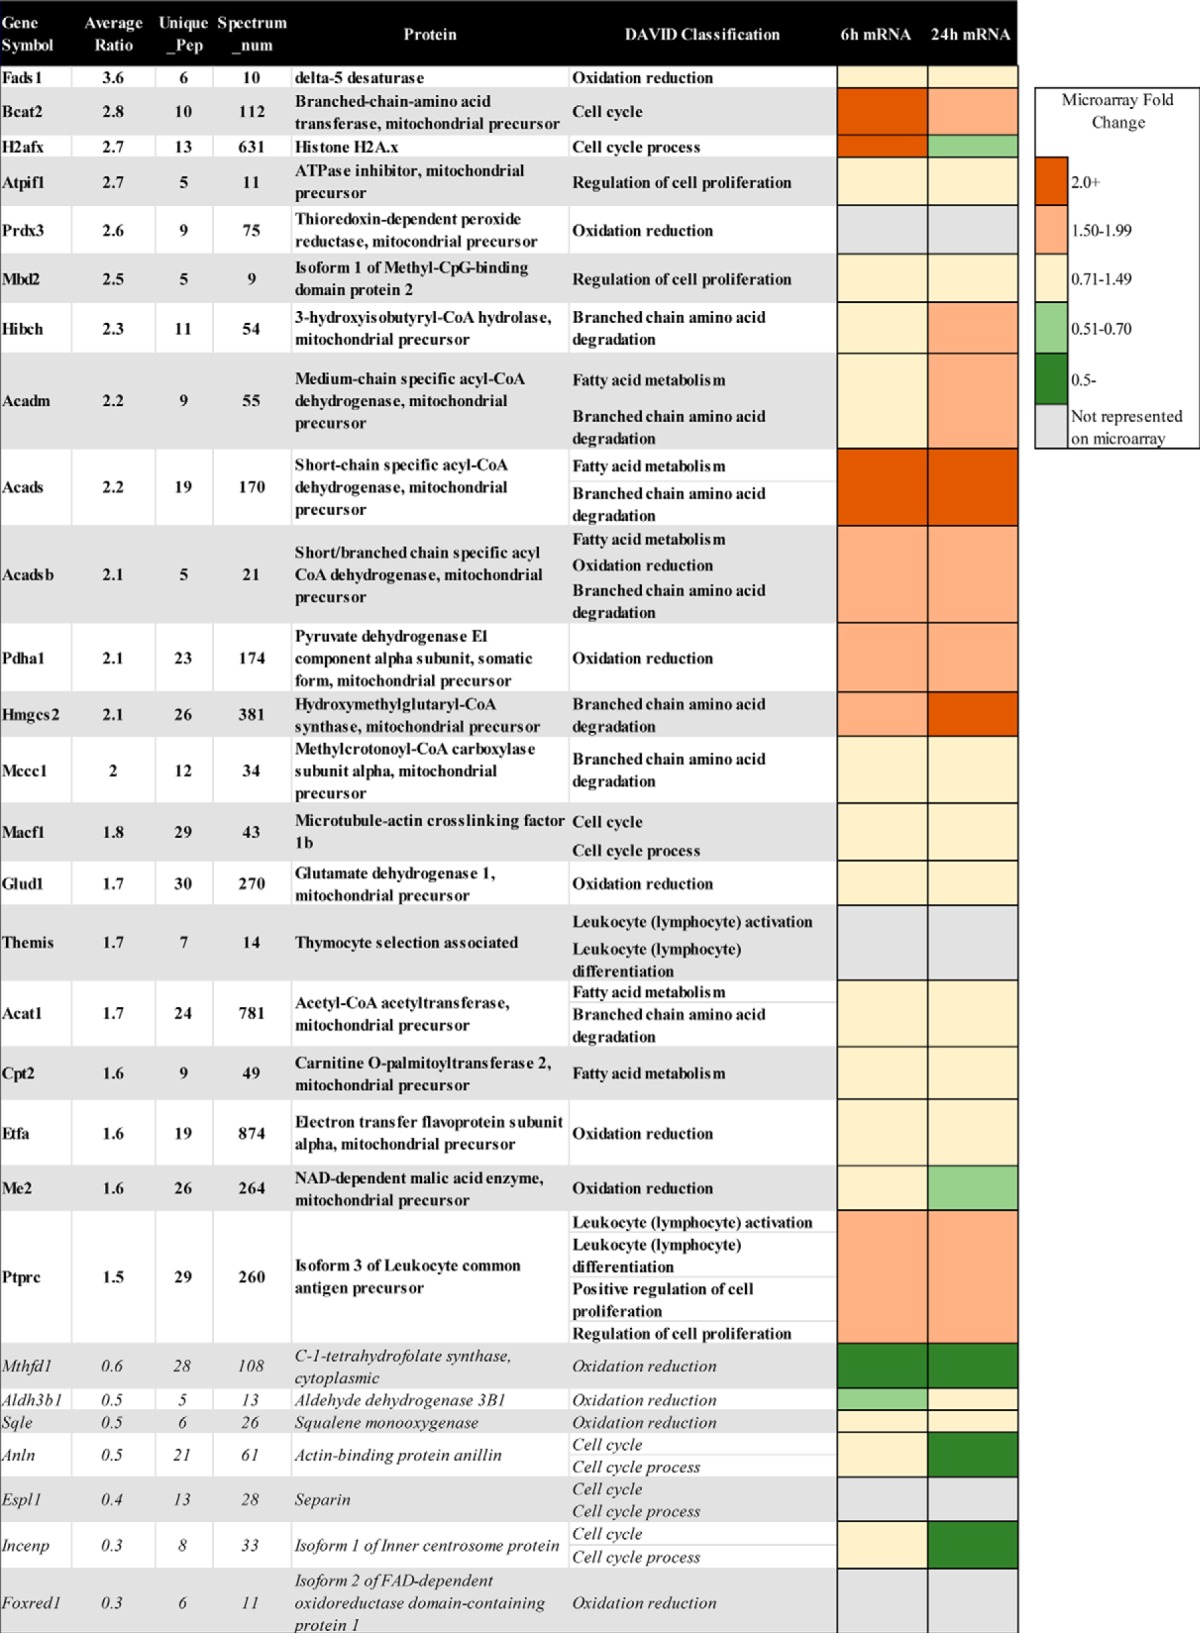
TABLE 2.
Proteins showing significant changes in CPT-cAMP-treated WT S49 cells, 16h
Proteins whose levels of expression increased or decreased in WT S49 cells incubated with CPT-cAMP for 16 h relative to basal (control) conditions are shown. No protein had altered expression in kin− S49 cells incubated with CPT-cAMP for 16 h. The average ratios of protein abundance (WT 16 h:WT control) from at least two biological replicates are presented. Data for proteins whose expression increased are shown in bold; proteins with decreased expression are shown in italics. The data include the number of unique peptides identified for each protein (Unique_pep), the number of PDQ spectra (Spectrum_num) used for each protein quantitation, the full protein name as determined by Spectrum Mill, and the functional classification assigned by the DAVID bioinformatics software. Gene expression from previously published microarray analysis (14) is represented at the right by a heatmap.

