
FIGURE 5.
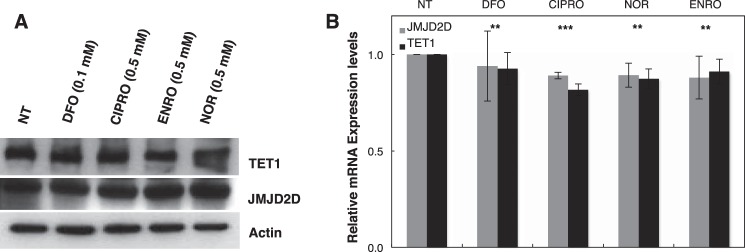
JMJD2D and TET1 enzyme levels in HEK293 cells treated with indicated FQ. A, TET1 and JMJD2D abundance by Western blotting after 4 h of treatment with the indicated FQs (0.5 mm). B, TET1 and JMJD2D mRNA expression levels in cells after 24 h of indicated FQ treatment. Data are means ± S.D. reflecting n ≥3 independent experiments. Statistical analysis by paired t test (compared with NT control, diluent only) is shown. Statistical significance (**, p ≤ 0.05; ***, p ≤ 0.005) is shown.