
FIGURE 9.
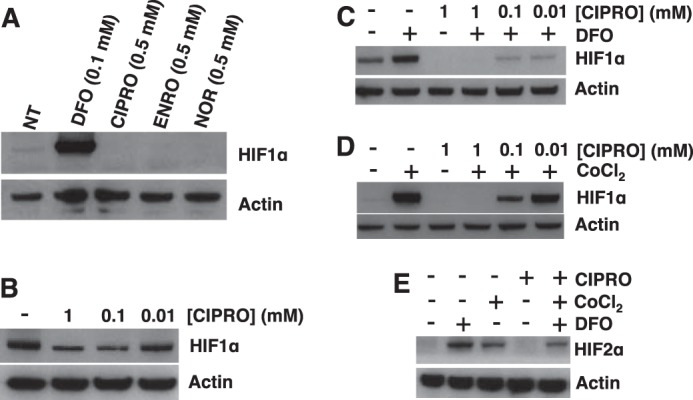
FQs suppress HIF-1α in HEK293 cells. A, relative HIF-1α levels assessed by Western blotting in HEK293 cells with 0.5 mm FQ treatment for 4 h in hypoxia (2% oxygen). B, HIF-1α levels in HEK293 cells treated with CIPRO in hypoxia. HIF-1α status in HEK293 cells with co-treatment of CIPRO and DFO (C) or CoCl2 for 4 h in hypoxia (D) is shown. E, HIF-2α levels in HEK293 cells with co-treatment of CIPRO and DEF or CoCl2 in hypoxia for 4 h. 100 μm DFO (positive control) or CoCl2 (positive control) was used in the co-treatment experiments. NT (diluent only).