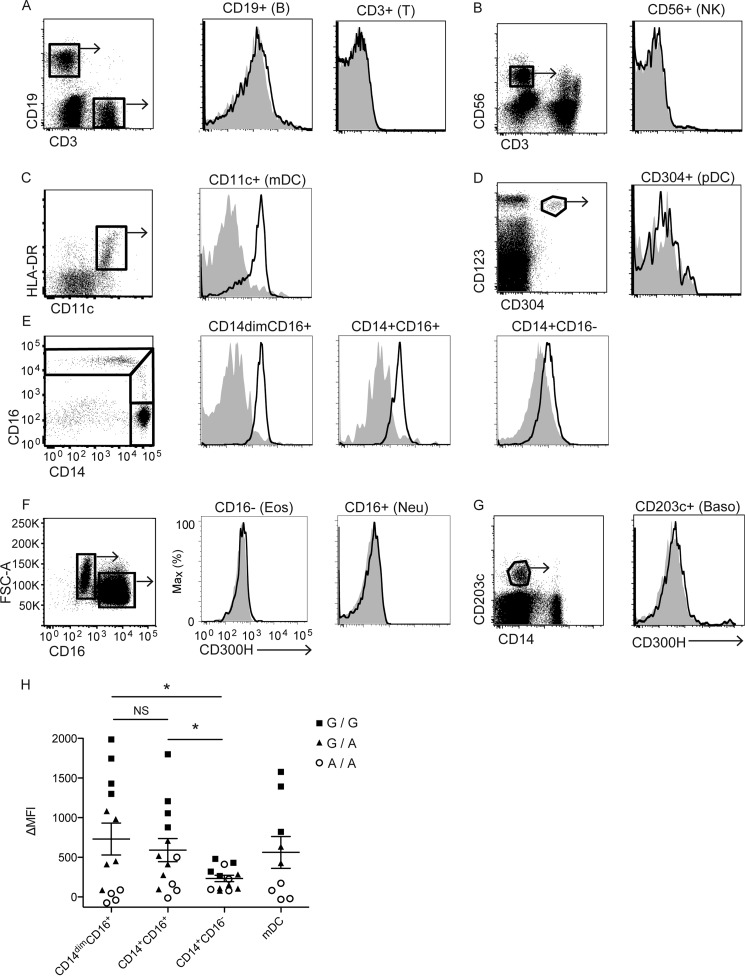
FIGURE 3.
Expression of human CD300H protein. A–G, flow cytometry of peripheral blood mononuclear cells (5 × 10⁵ cells/experiment) from healthy donors. Cells were stained with specific antibodies to distinguish different cell subsets and simultaneously stained with biotinylated control mouse immunoglobulin (shaded) or anti-CD300H (TX93) (thick lines), followed by phosphatidylethanolamine/Cy-7 streptavidin. PI-positive dead cells were excluded. Cells in outlined areas were gated and analyzed for CD300H expression. Cells in C are lineage (CD3, CD19, CD56, CD14)−. Cells in E are lineage (CD3, CD19, CD56)− HLA-DR+. HLA-DR, human leukocyte antigen-DR; FSC-A, forward scatter-area; B, B cell; T, T cell; NK, natural killer cell; mDC, myeloid dendritic cell; pDC, plasmacytoid dendritic cell; Eos, eosinophil; Neu, neutrophil; Baso, basophil. Data are representative of at least three independent experiments. H, the MFI of CD300H expression on each cell type from each individual carrying A/A (circles), G/A (triangles), or G/G (squares) genotype is shown. ΔMFI, MFI of control stained with isotype was subtracted from MFI of CD300H stained with anti-CD300H (TX93). *, p < 0.05; NS, not significant.

