Figure 1.
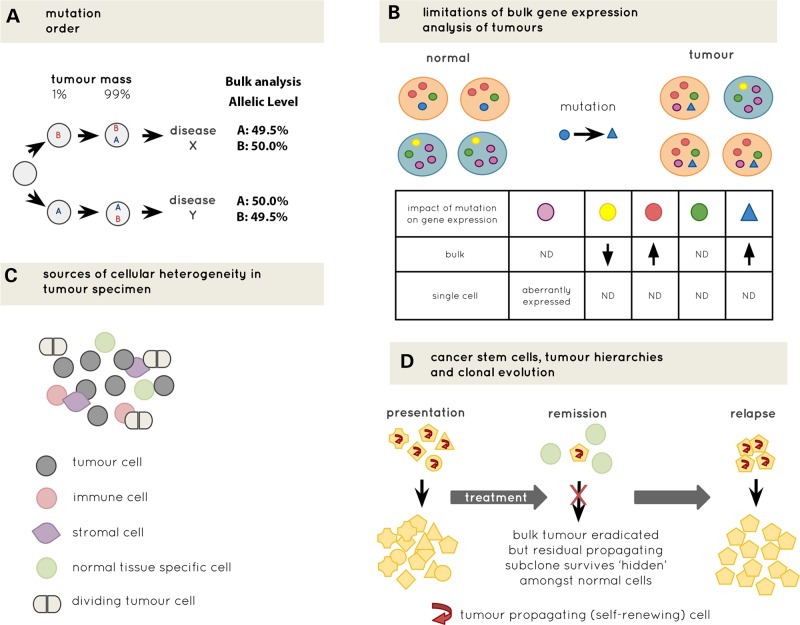
Advantages of single-cell analysis. (A) Diagrammatic illustration of different consequences of mutation order on disease phenotype. Cells informative for mutation order may be very rare within tumours (1% in this example) and bulk sequencing is unlikely to have sufficient resolution to determine mutation order as reads for each mutation (A and B) will be almost identical for mutations with a very similar allelic level. (B) Comparison of single cell versus bulk gene expression analysis. Different coloured cells (orange and blue) represent different cell types. Different coloured spots within cells represent expression level of different genes. Acquisition of a somatic mutation in the blue gene causes an expansion of orange cells. The table shows the distinct gene-expression differences detected by single cell and bulk analysis. (C) Heterogeneity of cellular composition of tumours that would be lost through bulk analysis. (D) Diagrammatic illustration of hierarchical organization within tumours throughout the disease course. Yellow indicates tumour cells, green non-tumour cells and different shapes represent different subclones of cells. This hierarchical and clonal complexity would be lost through bulk analysis. ND indicates no difference.

