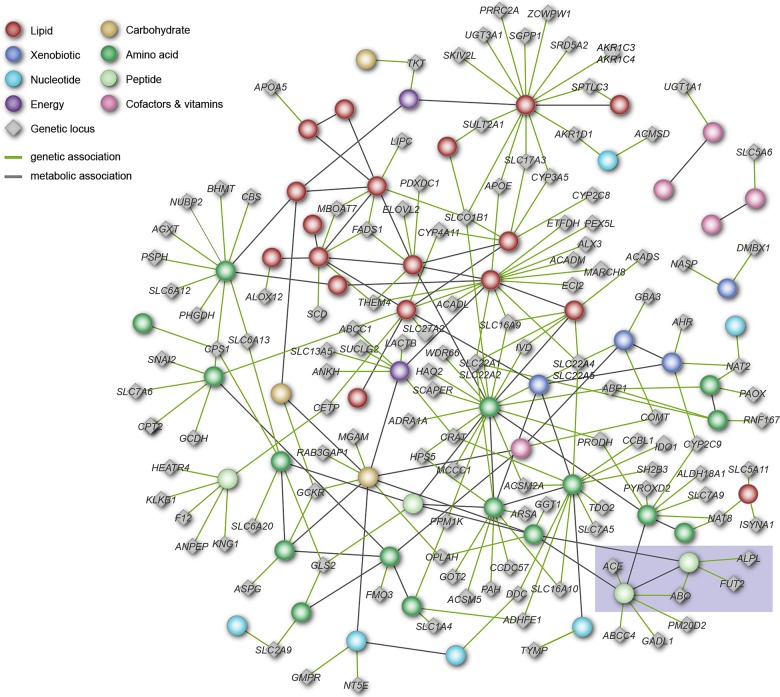
Figure 2.
Network integrating gene–metabolite associations and metabolite–metabolite correlations. Individual metabolites are lumped by pathway (colored circles) and colored by their general metabolic properties (see legend). Genetic loci (gray diamonds) are annotated by the gene that is most likely affected by the variant. Green edges between loci and metabolites represent significant genetic associations with metabolic traits. Gray edges between metabolites represent significant partial correlations between metabolic traits. The highlighted sub-network (shaded box) is further discussed in Figure 3. The full network is freely accessible in digital format at http://gwas.eu/si [figure adapted from Figure 2 by Shin et al., Nature Genetics, 2014 (23)].

