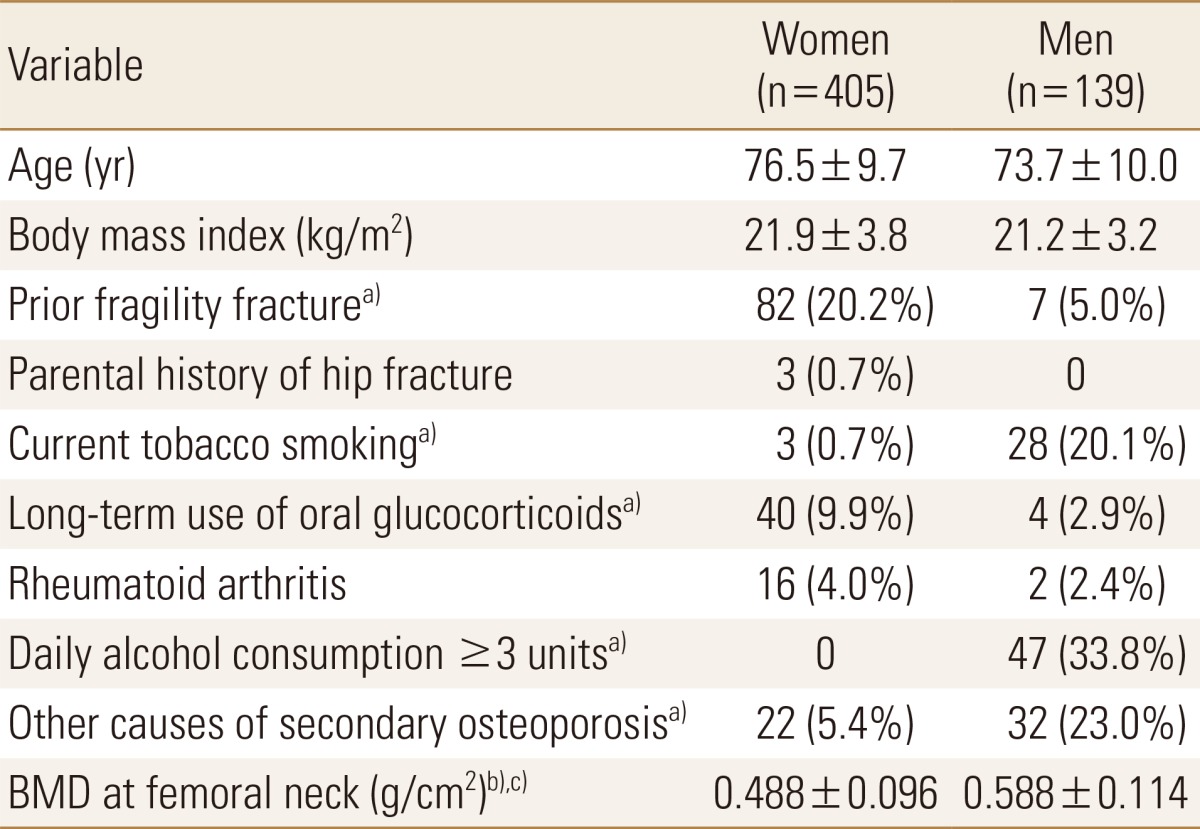
Table 1. Study subject variables included in the fracture-risk assessment tool model.

Data are presented as the mean±standard deviation (SD) or number (percentage).
a)P<0.05 between the sexes by the Fisher's exact or chi-square test, as indicated.
b)P<0.05 between sexes by t test.
c)n=202 for women, n=40 for men.
BMD, bone mineral density.
