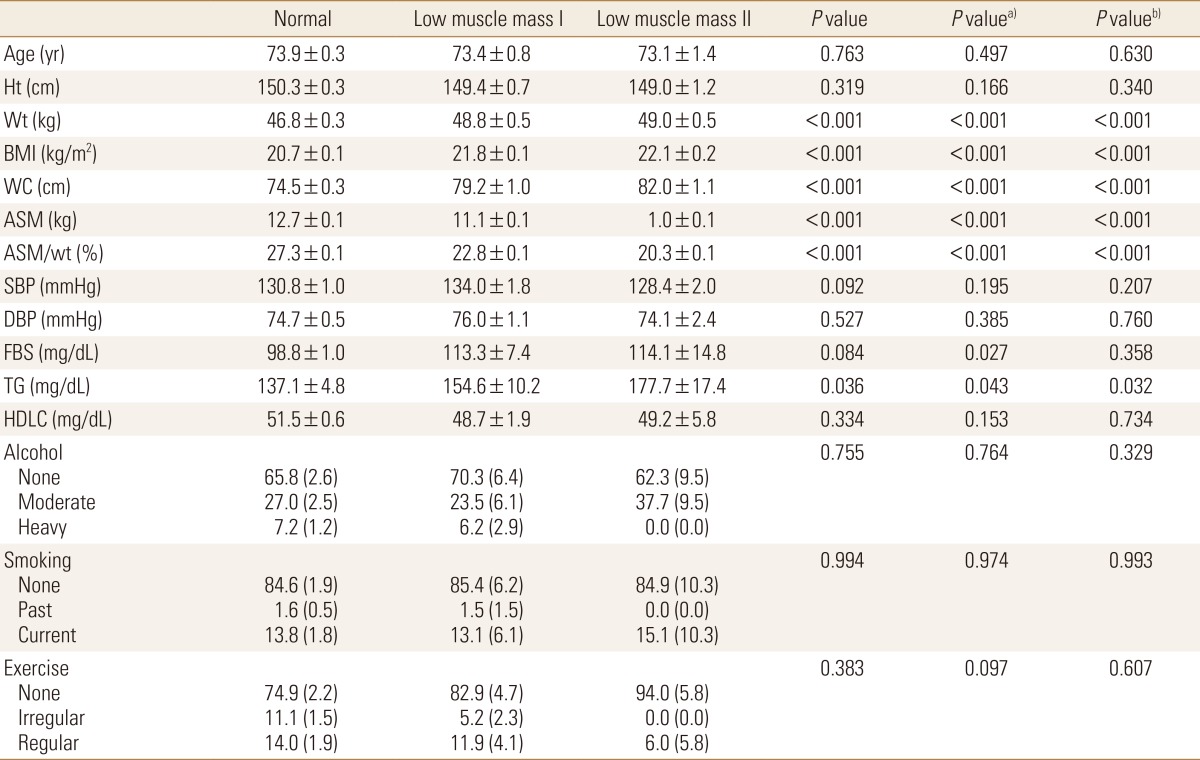
Table 2. General characteristics of normal body mass index women.

Calculated by complex sample general linear model and complex sample logistic regression analysis.
Values are expressed as mean±standard error, estimated % (standard error).
a)P value for normal vs. low muscle mass I and II.
b)P value for normal and low muscle mass grade I vs. low muscle mass grade II.
Ht, height; Wt, weight; BMI, body mass index; WC, waist circumference; ASM, appendicular skeletal muscle mas; SBP, systolic blood pressure; DBP, diastolic blood pressure; FBS, fasting plasma sugar; TG, triglyceride; HDLC, high-density lipoprotein cholesterol.
