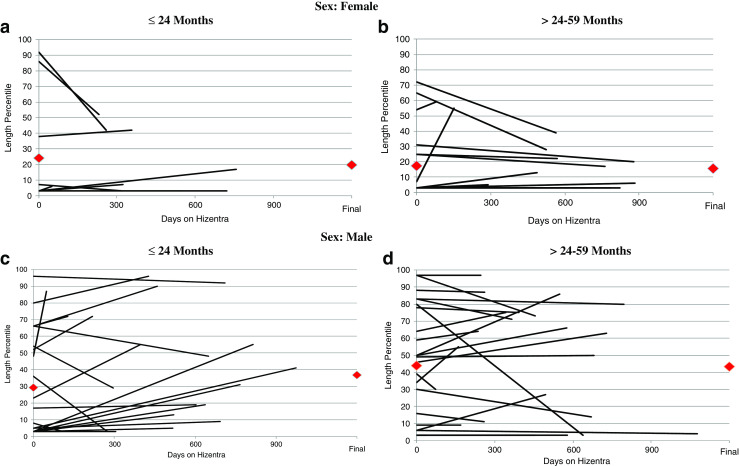
Fig. 3.

(A-D): Length percentile measurements are shown at the start and completion of Hizentra® therapy for 74 patients. A and B include females (<=24 and >24–59 months, respectively). C and D similarly show males (<=24 and >24–59 months, respectively). Each line represents 1 patient, and red diamonds ( ) represent mean length percentile at first and last measurement on Hizentra®
