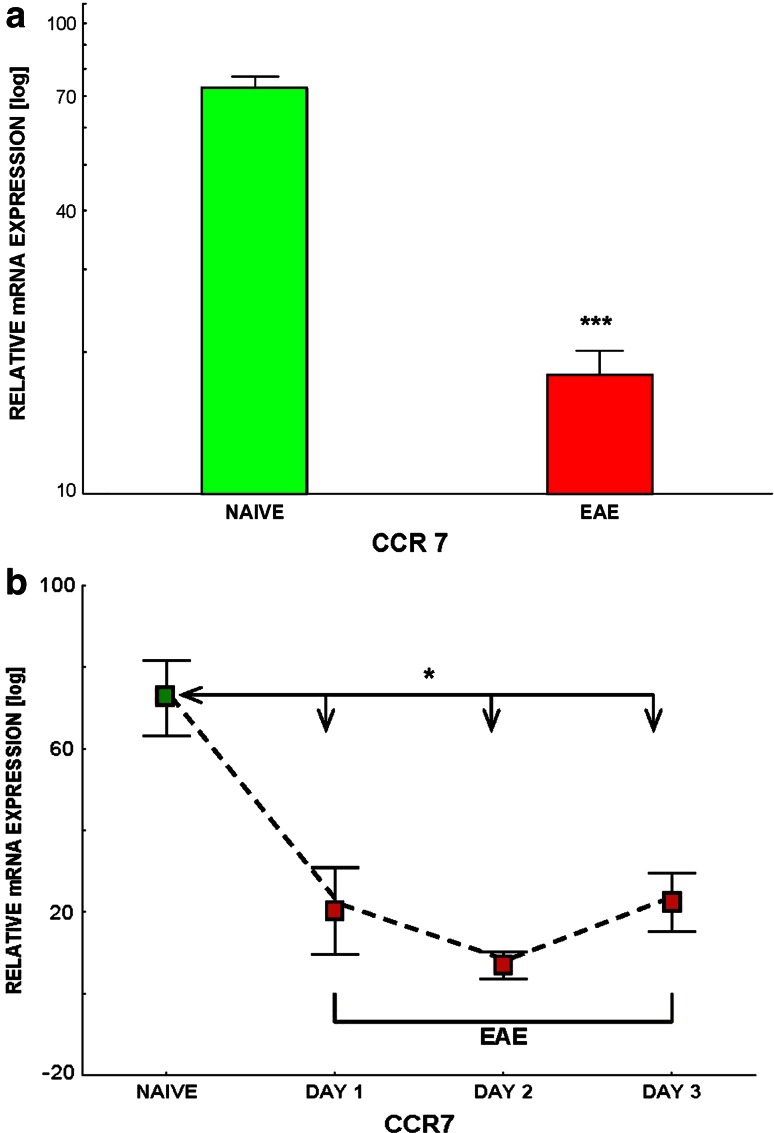
Fig. 5.
a, b Comparison of expression (analysis using qPCR) of CCR7 in mononuclear cells isolated from the blood of control animals (NAÏVE) and in animals with acute phase of ChREAE (EAE). The isolation method of PBMC is presented in “Materials and methods”. Each box represents the group of 5–12 animals. The representative experiment is shown. b The kinetics of expression of CCR7 by PBMC during subsequent days following development of the first clinical symptoms of ChREAE. Significance is denoted as *p < 0.05

