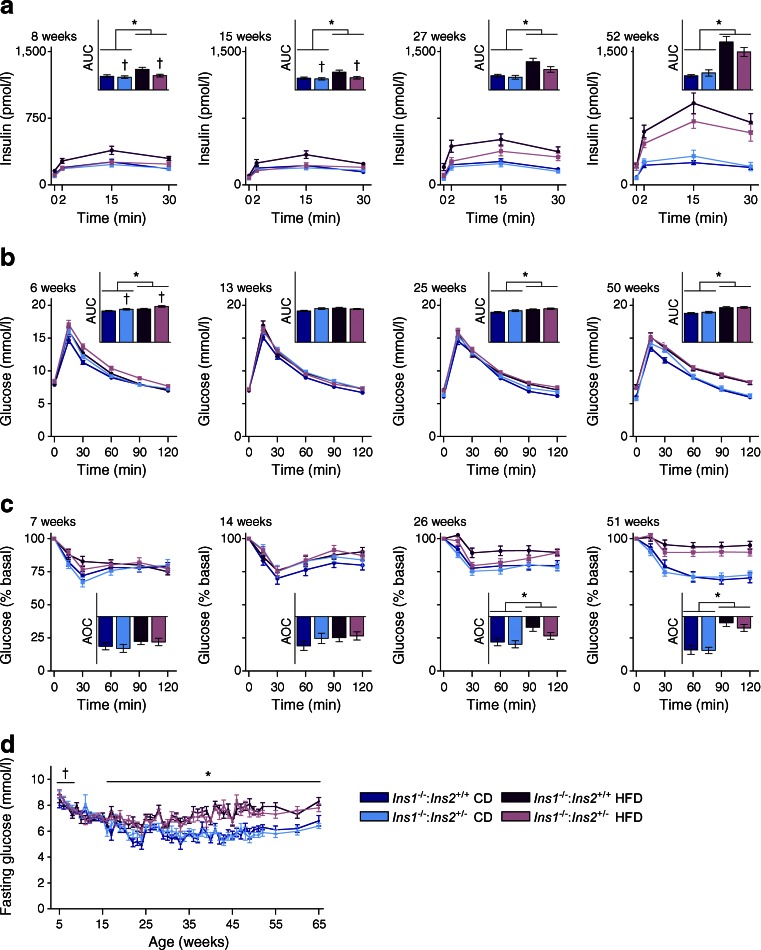
Fig. 2.
Longitudinal glucose homeostasis. Periodic measurements of glucose-stimulated insulin secretion (n = 17–21) (a), blood glucose responses to intraperitoneal glucose (n = 29–34) (b) and insulin analogue (n = 29–34) (c) are shown, together with AUC or area over curve (AOC) (insets, y-axis units, pmol/l × min [a], mmol/l × min [b] and % × min [c]) and fasted blood glucose (n = 15–18, most time points) (d). Dark blue, CD-fed Ins1 −/−:Ins2 +/+ mice; dark purple, HFD-fed Ins1 −/−:Ins2 +/+ mice; light blue, CD-fed Ins1 −/−:Ins2 +/− mice; light purple, HFD-fed Ins1 −/−:Ins2 +/− mice. Data are means ± SEM. *p ≤ 0.05, CD vs HFD; † p ≤ 0.05, Ins1 −/−:Ins2 +/+ vs Ins1 −/−:Ins2 +/−

