Fig. 5.
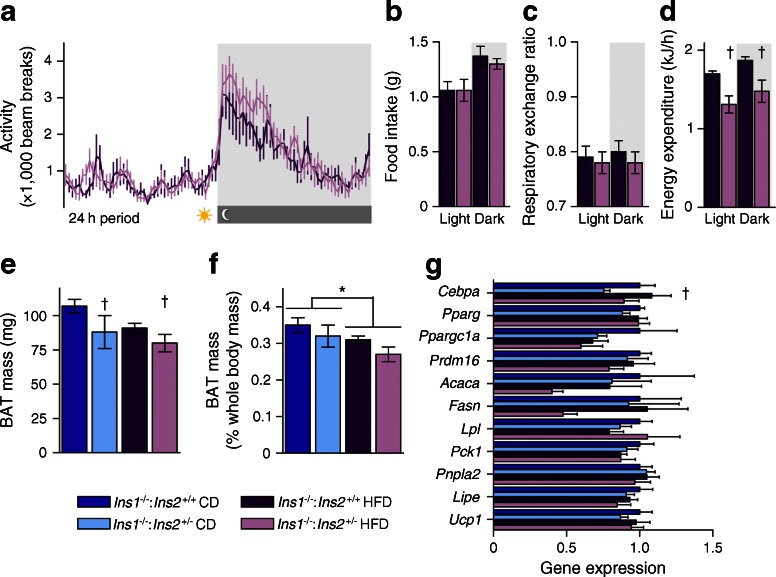
Energy homeostasis and brown adipose tissue. (a–d) In HFD-fed 17-week-old mice (n = 6–8), 24 h activity (a), food intake (b), respiratory exchange ratio (c) and energy expenditure (d) were averaged across 48–84 h; the dark period is shown in grey. (e, f) In 25-week-old mice (n = 5–7), BAT depot mass is shown as absolute values (e) and proportional to body mass (f). (g) mRNA levels of genes expressed in BAT are corrected against Tbp and normalised to levels in CD-fed Ins1 −/−:Ins2 +/+ mice. Dark blue, CD-fed Ins1 −/−:Ins2 +/+ mice; dark purple, HFD-fed Ins1 −/−:Ins2 +/+ mice; light blue, CD-fed Ins1 −/−:Ins2 +/− mice; light purple, HFD-fed Ins1 −/−:Ins2 +/− mice. Energy expenditure is shown as estimated marginal means ± SEM, adjusted for covariates of lean and fat mass; other data are simple means ± SEM. *p ≤ 0.05, CD vs HFD; † p ≤ 0.05, Ins1 −/−:Ins2 +/+ vs Ins1 −/−:Ins2 +/−

