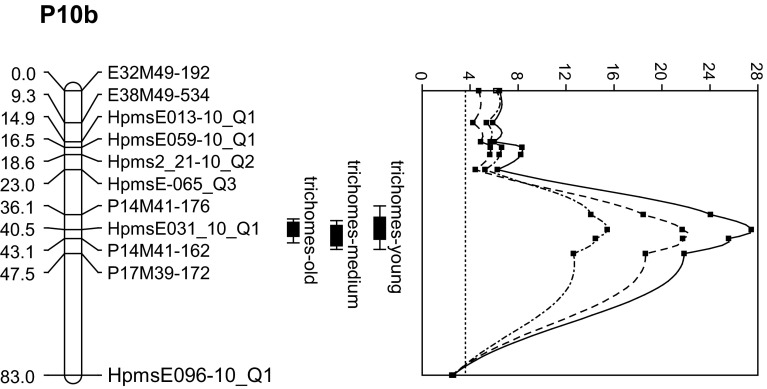
Fig. 3.
LOD profiles and 1-LOD and 2-LOD support intervals for QTL for trichome density on chromosome 10. Solid, dashes, and dot-dashed lines represent the trichome density at early vegetative, late vegetative, and reproductive stage, respectively. The dotted line at LOD 3.6 represents the LOD threshold

