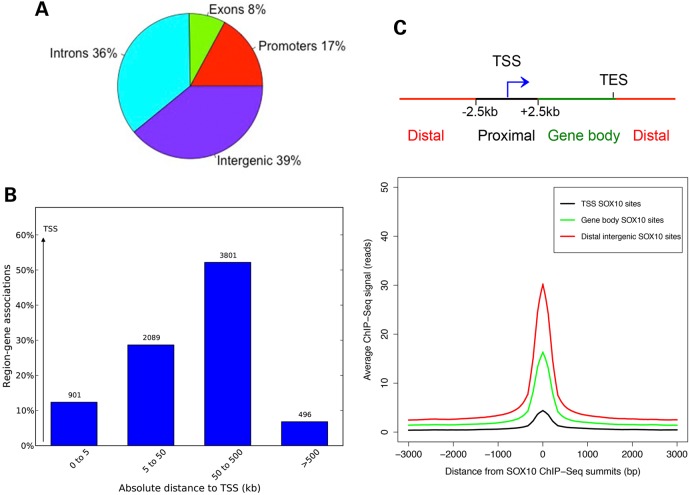
Figure 3.
Genomic distribution of SOX10-binding sites in melanocytes. (A) Pie chart showing the distribution of SOX10 peaks across gene features (promoters or within [−2.5 kb, +2.5 kb] window around TSS, exons, introns and intergenic regions). (B) Genomic distribution of SOX10 peaks with respect to TSS of genes associated with SOX10 ChIP-Seq peaks in melanocytes. Peak and gene associations were performed using GREAT (22) by applying the basal plus extension settings. GREAT assigns biological meaning to genomic regions by analyzing the annotations of nearby genes and regulatory elements wherein genomic distances are divided into bins relative to TSS as [0, 5 kb], [5 kb, 50 kb], [50 kb, 500 kb], [500 kb, infinity]. Values on the Y-axis represent percent of peaks found in a given genomic region. Values displayed on bar graphs represent number of genes associated with peaks in each genomic window. (C) Top, schematic showing genomic categories for classifying SOX10 ChIP-Seq peaks. TSS SOX10 peaks = peaks within [−2.5 kb, +2.5 kb] of TSS; Distal intergenic SOX10 peaks = peaks >2.5 kb away on either sides of TSS; gene body SOX10 peaks = peaks not in TSS or gene body. Bottom, line plot showing average ChIP-seq signal intensities (read counts on y-axis) for SOX10 peaks located at TSS, gene body and distal intergenic site for a [−3000 bp, +3000 bp] window with respect to SOX10 summits (x-axis).

