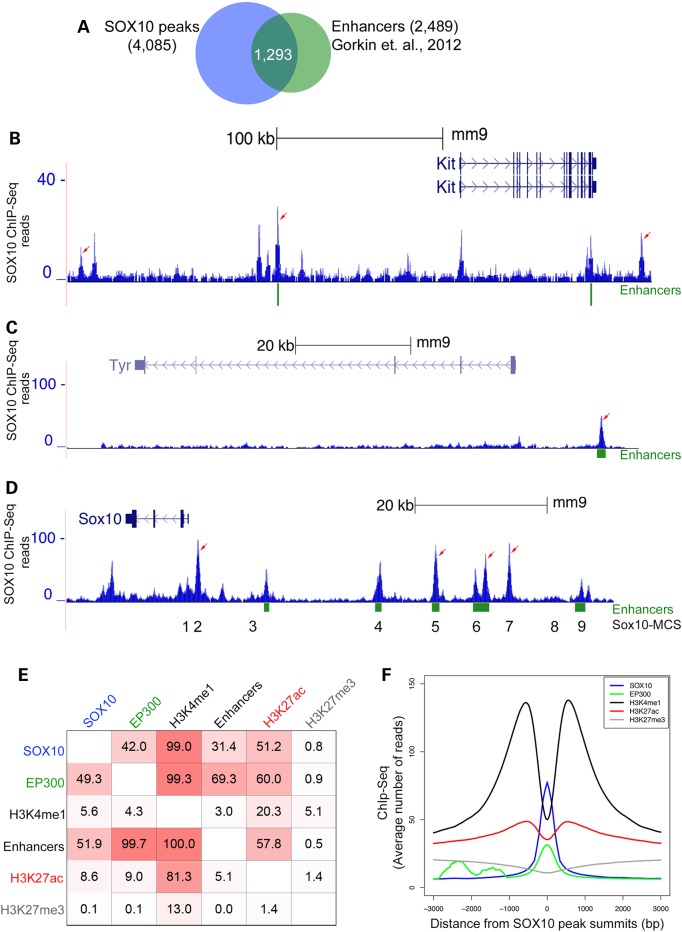
Figure 4.
Analysis of the relationship between SOX10 genomic binding and epigenetic chromatin properties in melanocytes. (A) Venn diagram showing overlap of SOX10 peaks with putative melanocyte enhancer elements. (B–D) UCSC genome browser tracks showing genomic interaction of SOX10 with distal enhancer elements at Kit, Tyr, and Sox10 loci, respectively, in melanocytes. Values on the y-axis represent input-normalized read counts or intensities of ChIP-Seq data. For each locus shown, arrows indicate replicated SOX10 peaks having statistically significant binding enrichment over genomic background (input DNA). Green rectangular blocks below the genome browser tracks indicate putative melanocyte enhancer elements (33). Numbers 1 through 9 below the Sox10 genome browser track correspond to approximate locations of Sox10 multispecies conserved sequences or Sox10-MCS (24). (E) Relationship of SOX10 cistrome with EP300 chromatin occupancy and histone modification (H3K4me1, H3K4me2 and H3K4me3) regions identified by ChIP-Seq. Values in each square represent percent overlap of a peak or chromatin region on the left with another peak or chromatin region on the top by at least 1 bp. All ChIP-Seq regions represent replicated peaks from at least two independent experiments. SOX10 (n = 4085); EP300 [n = 3539; (33)]; H3K4me1 [n = 75956; (33)]; Enhancers [n = 2489; (33)]; H3K27ac (n = 52 553); H3K27me3 (n = 37 270). (F) Distribution of SOX10, H3K4me1 (33), EP300 (33), H3K27ac and H3K27me3 ChIP-Seq reads across all SOX10-occupied regions in melanocytes. For each factor average ChIP-Seq reads are plotted within [−3 kb, +3 kb] window around SOX10 peak centers (summits).

