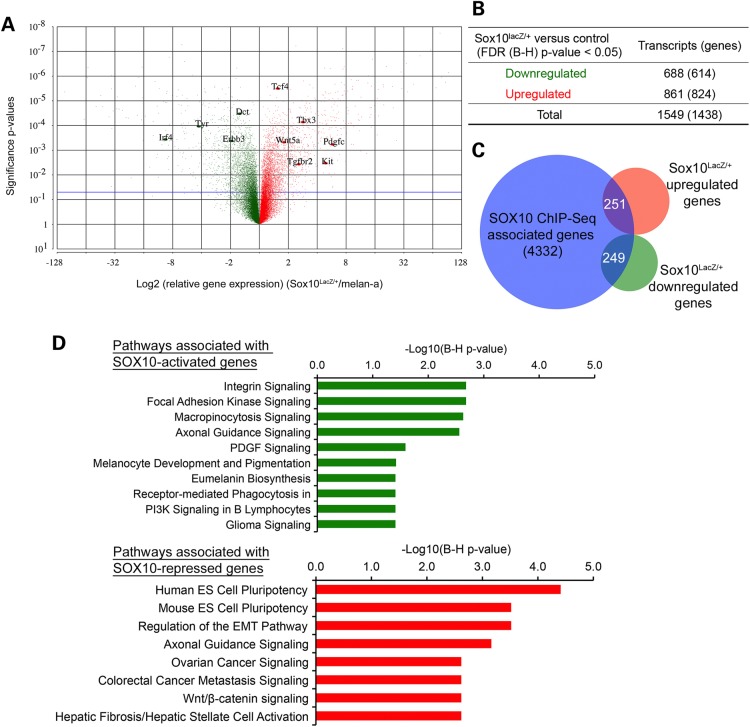
Figure 5.
Identification of SOX10 target genes in melanocytes. (A) Volcano plot showing all differentially regulated transcripts or probe sets in Sox10LacZ/+ versus melan-a RNA samples assayed by microarray on the Affymetrix GeneChip® Mouse Gene 1.0 ST array. Significance probability values (y-axis) are plotted against the Log2 (expression fold changes) (Sox10LacZ/+/melan-a) on x-axis. Red = upregulated; Green = downregulated. Horizontal blue line represents unadjusted significance P-value cutoff of 0.05. (B) Summary of significantly upregulated or downregulated transcripts (genes) in Sox10LacZ/+ versus control melan-a RNA samples at FDR (B–H) adjusted P < 0.05. (C) Venn diagram showing the overlap of SOX10 ChIP-Seq associated genes (genes that have at least one SOX10-binding site associated with them) and genes whose expression is significantly altered in Sox10LacZ/+ versus control melan-a cells. (D) IPA Pathway enrichment analysis of SOX10-activated and SOX10-repressed target genes, i.e. genes having at least one associated SOX10 peak and showing significant differential expression change in Sox10LacZ/+ versus melan-a cells. Upper panel, SOX10-activated target genes; lower panel, SOX10-repressed target genes. Negative Log10 (B–H corrected P-values) represent significance of enrichment for pathway members shown.

