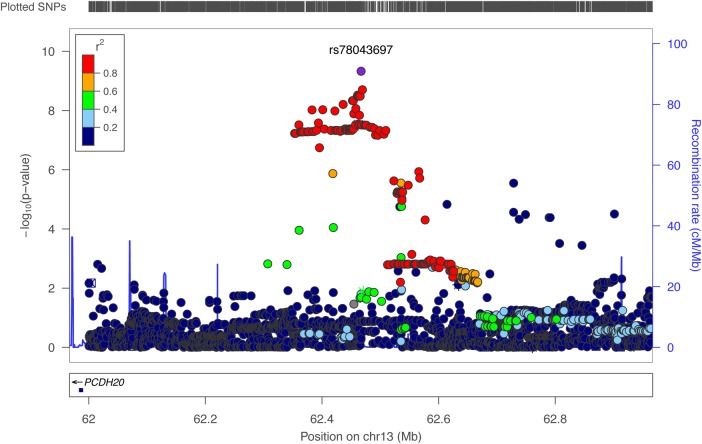
Figure 1.
Locus-zoom plot for chromosome 13 locus. The plot shows the locus on chromosome 13 associated with normal hearing functions measured at 2 kHz, highlighting the top SNP rs78043697 and several other significant SNPs in the same region being in high linkage disequilibrium. The results plotted were obtained with a two-stage meta-analysis, focusing on Italian isolates first and then including the communities from the Silk Road. The y-axis shows −log10 of the P-values obtained from the complete meta-analysis of the 2 kHz hearing threshold. The closest gene PCDH20 is shown along the x-axis.

